3 Ways Newsrooms are Sharing Content Analytics with Readers

Analytics in the newsroom have helped journalists and journalism organizations uncover surprising things about their readers — but can analytics help readers uncover more about themselves?
Here are three examples of how newsrooms can use content analytics information as more than an exclusively internal source of information.
Making the Most of Most Popular Lists
Across Parse.ly’s network, some media sites publish hundreds of posts each day. Can your readers quickly find the most popular stories on your site? Whether it’s through an email newsletter, a module on your site, or within another post, most popular lists are a fairly simple way to make sure that your audience sees your best work. Think of it as curating content based on readers’ interest.

Most popular lists can help encourage loyalty within your audience. How effective are they? Parse.ly sent blog subscribers a list of our most popular articles at the end of 2015, and close to 30 percent of readers went on to read one of those articles that they hadn’t seen before.

If this is something you’re already doing, see if there are specific areas of your site that could benefit from other forms of “most read.” For example, highlight the most read authors, point out which sections are most popular, or even tell readers which tags are most popular on your site (including a selection of articles that use those tags). Providing easy ways for visitors to find your best work encourages more engagement with your audience.
Giving Readers Access to Their Consumption Analytics
Ready to graduate beyond “top 10 lists” for reader analytics? When we looked at 3,500 of our user profiles, we found that writers and editors spent most of their time looking at the analytics associated with their author pages: the summary of all of their work on a site.
Would readers be interested in analytics about all the articles they read on a site? In 2014, a group in a news hackathon created “Newstrition,” a Chrome extension they hoped would help readers understand their “content diet.”
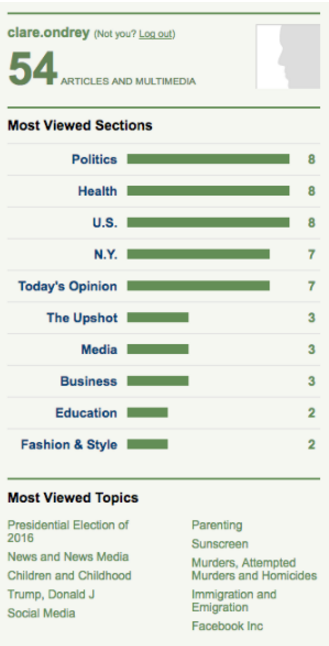
The New York Times provides subscribers with their own version of this, along with a list of recommended articles based on the subscriber’s history.
Just as I find my own Fitbit data or sleep information interesting, I’m intrigued by my own reading habits, and am driven to continue reading The New York Times so that I can learn more about myself. Though it’s a sample of one, this use of analytics has connected me closer to The New York Times brand: a goal that many media brands aim to reach.

Embracing Radical Transparency
In an effort to connect with consumers, some companies have tried going the route of radical transparency to engage with their audience. In 2012, email testing and analytics service, Litmus, made its metrics from the previous year public for all of its email campaigns.
https://litmus.com/blog/a-year-in-review-looking-back-on-our-2012-emails
How can media companies incorporate transparency in a way that inspires loyalty from their readers? While some media brands have created premium content products, including Slate’s Slate Plus, The New York Times Insider, and Greentech Media’s GTM Squared, each of these focus on providing additional content.
Are there opportunities for media brands to share more about their business through analytics?
You do not have to share all of your sensitive information, but opening up about your internal analytics can help readers understand the nature of your business better. In a time when innovation is needed to combat problems like ad blocking and increasing monetization, it behooves media companies to get the most they can out of existing services — while taking every opportunity they can to connect with their readers.