3 Ways to Improve Newsroom Management

Managing a digital newsroom is hard work.
It’s tough to manage the sheer volume of content published by scores of writers, let alone evaluate performance for each of them, stay on track with goals, and put out all the day-to-day fires that pop up.
To make your job easier and improve your own performance as an editor or newsroom manager, Parse.ly offers a single content analytics tool to:
- Track published content by date
- Monitor content performance across team members
- Unify team strategy and efforts
“I love using Parse.ly. I’m engaged with the product every day. It provides critical info and data to the organization and leadership. We leverage the output to make important decisions and manage the business.”
Sean Giancola – CEO, New York Post
Track published content by date
Answering the question “What did we write this week?” can be more complex than it seems. Either you scroll through all the content on your site or navigate convoluted reports and multiple dashboards in Google Analytics.
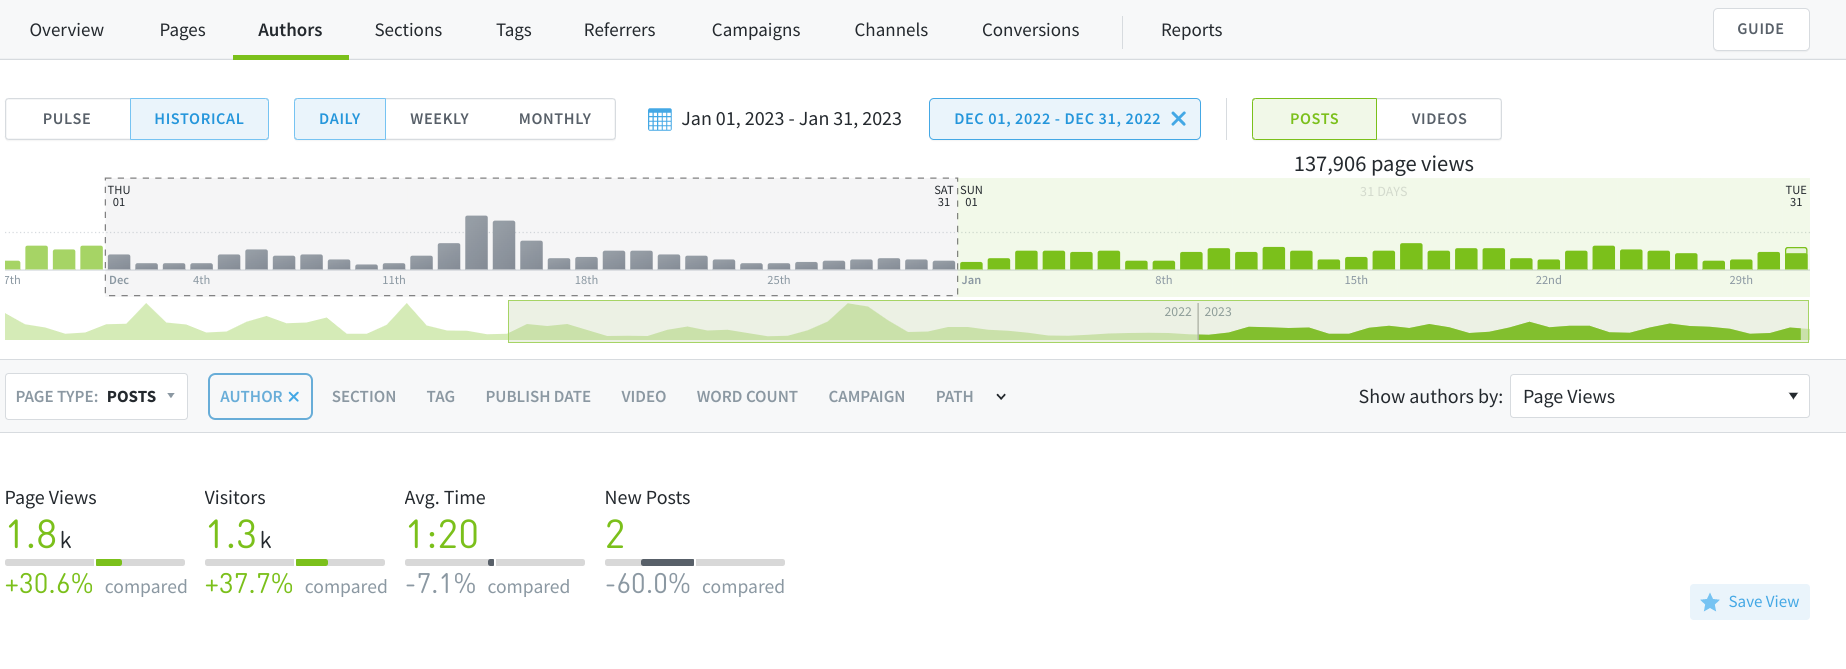
With Parse.ly, however, the publish date filter is the fastest way to find content published within a given timeframe. Whether you want to know what was published by a certain author, on a certain topic, or within a certain section, the publish date filter makes it easy to keep tabs on everything in the framework that makes sense for you.
View content by author
To see how many posts each author on your team published last month, for example, view the Authors tab and set the Publish Date filter to 1 Month.

This view shows a list of authors with post counts and contextualized performance for each person. From there, click an individual’s name to see:
- Each post they published (with publish date, tags, section, etc.)
- The basic performance of all of their content combined
- The performance of each piece individually
- Other KPIs like recirculation rate, referral traffic, and engaged time
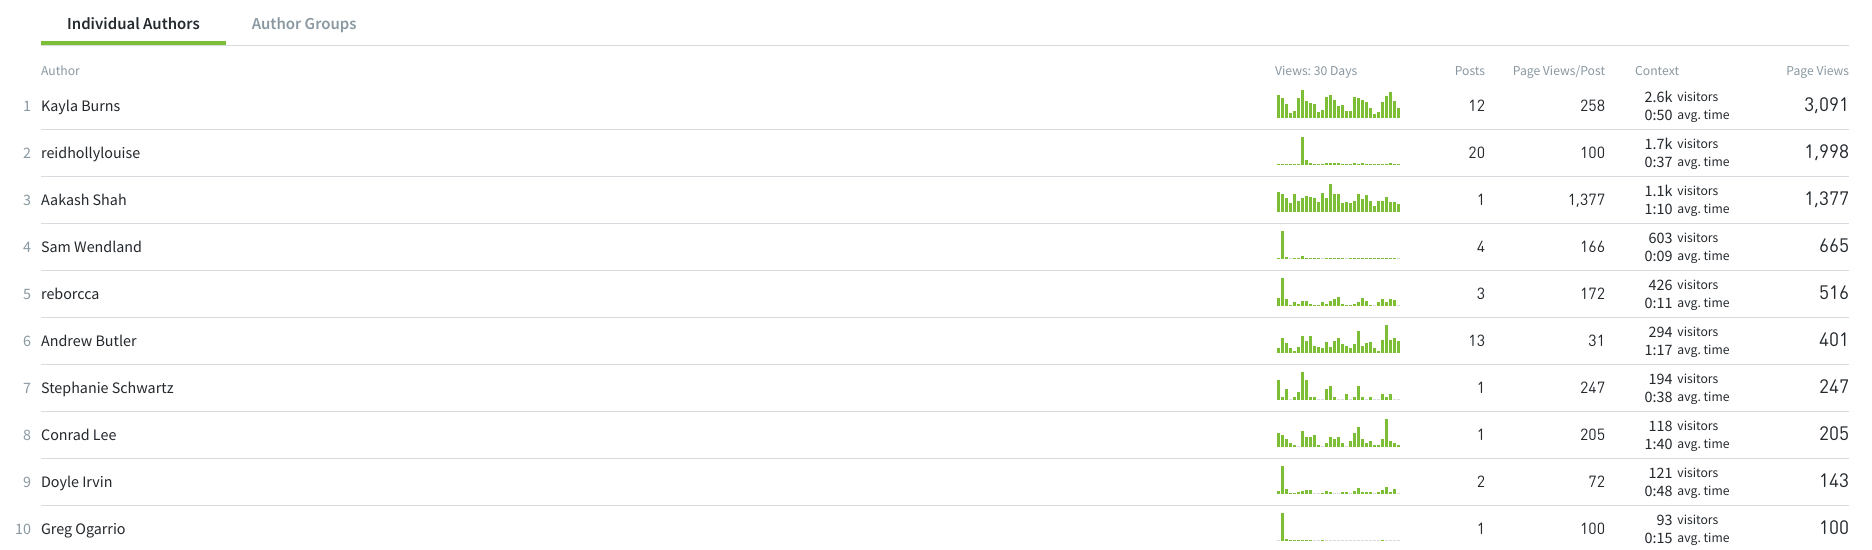
Further sort and filter content to inform performance reviews, story ideas, placement, and overall editorial strategy.
View content by topic tag
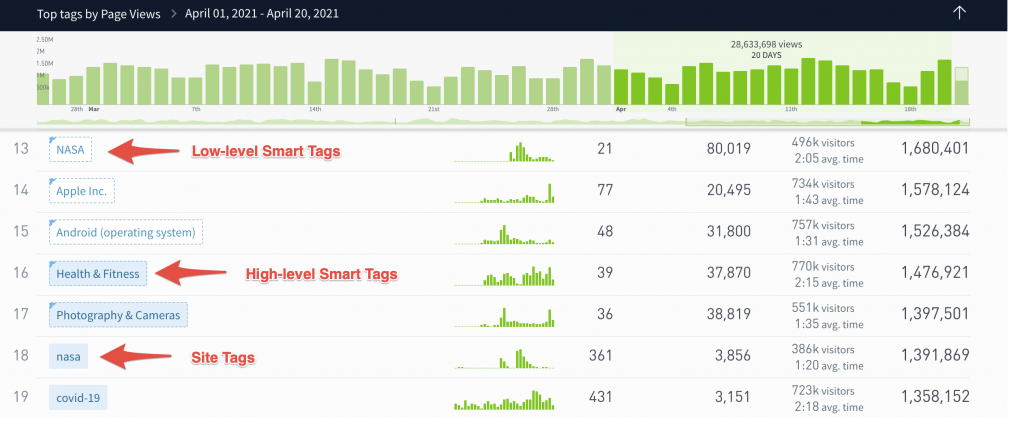
Sorting content by subject-matter tag is ideal for assessing historical performance and trends for the topics your team covers. For example, to check what topics were most published over the last few months, head to the Tags tab and set the publish date filter to include everything within 6 months to 3 months.
If you tag pieces by subject matter, you’ll see your content sorted by topics, with the number of posts and basic performance metrics for each. Then, click on a specific topic tag to see a full list of pieces published during that time and the performance of each.
Within the tag list, you’ll see your own user-submitted tags alongside Parse.ly’s Smart Tags, which automatically tag your content based on its subject matter. Smart Tags act similarly to user-submitted tags but are derived by machine learning models and applied to new posts with no user action required.
View content by section
Use the publish date filter to quickly view all content published under a specific section of your website in a given timeframe. For example, if you’re a managing editor for the Technology section, you can keep tabs on everything published by your team each week and how it’s performing. Here, you would go to Sections, select Technology, and set the publish date filter to 1 Week. This is a fast way to provide general performance metrics for team meetings and one-on-one reviews, and inform future publishing decisions.
In this way, customer Ben Maxwell, Publishing Director of Network N, makes sure his team is writing only about things that matter most to their audience.

“This is part of my day-to-day management. I’m making sure the writers are focused on things that are going to perform, instead of what might be a passion project.”
Ben Maxwell – Publishing Director, Network N
Published content customer use case
I’m under a lot of pressure to keep up with a high demand for content, which means I need to monitor output closely and report on overall performance. In the Parse.ly dashboard, I can quickly figure out what was published each week and break it down into granular—yet easily-digestible—data. I usually pull a report each week from both the Tags and Author tabs using the publish date filter. Depending on what our focus is as that time, I can also sort by pageviews, engaged time, or any other KPI our leadership wants to see.
Monitor content performance across team members
The Authors Comparisons tab within the Author details pages lets you quickly compare and contrast author performance across one or multiple team members by:
- Performance
- Growth
- Engagement
- Loyalty
- Referring traffic
- Conversions
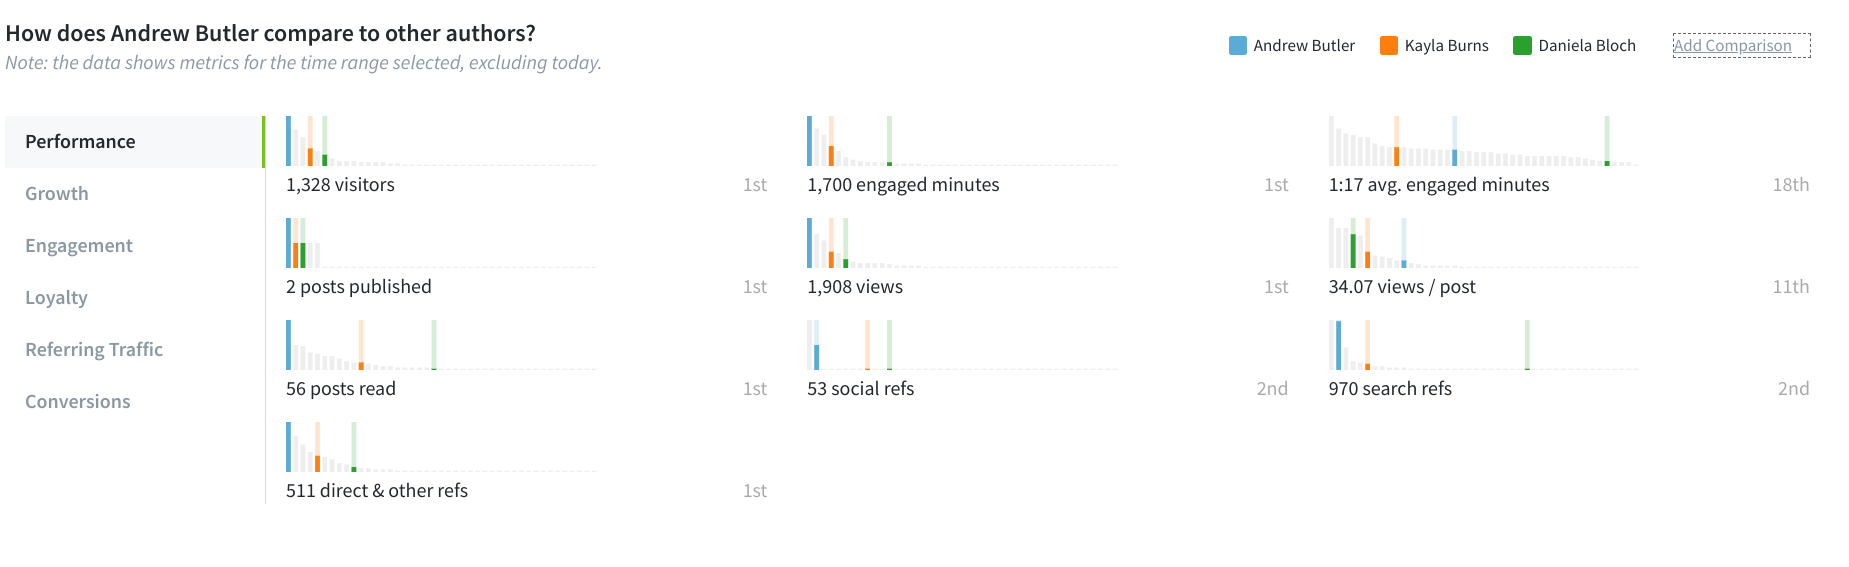
This offers a quick reference point to identify areas of improvement for coaching, either by you or other members of your team.
Parse.ly’s Author and Section Comparisons report helps you assess and compare author-to-author or section-to-section in one easy report. This is another way to identify which author is best at writing about specific topics (or for sections) and who needs to increase their output.
By evaluating the strengths and weaknesses of each author’s content, your team can share expertise and suggest improvements. Encourage each person to monitor their own performance as a chance to reflect and self-improve.
Tip: Parse.ly’s Content Intelligence is a great tool for authors to boost the effectiveness of their content.
As you continue to offer suggestions for improvement across your team, look at Parse.ly’s comparison mode for before-and-after evaluation of performance. This mode can also be used to check your audience’s fluctuation in topic interest over time, changes in metadata, goal progress, and more.
Team performance customer use case
I set up one-on-one meetings with each member of my team. Before we meet, I have them generate the Bottom Listings report. We go through that report and identify why those pieces didn’t do as well as others so we can focus our efforts going forward. I also run the Author Comparisons report to see where each person stacks up in our KPIs like engaged time and recirculation rate. This report gives me the opportunity to make suggestions for improvement in their publishing and provide examples of content they can use for reference.
Parse.ly makes it super easy for me to structure our one-on-one meetings and provide constructive feedback to improve each person’s individual performance. The author driving the most returning visitors to their stories even gets a public shout-out!
Unify team strategy and workflows
It’s hard to get everyone working toward the same goals. Look at your content strategy like a bobsled: it will go much farther and faster when everyone pulls in the same direction at the same time.
How do you do that? By making data accessible to everyone on the team, using real-time data, and aligning your goals.
Make data accessible to your team
As we say at Parse.ly, “There is no ‘I’ in data”—data analysis yields the best results as a team effort. When your entire team is looking at performance metrics, it’s less likely you’ll miss something important, and more likely you’ll identify areas of improvement quickly.
Encourage every writer (and the team as a whole) to dig into the performance of their content, a collective effort in optimizing content that will benefit the entire team.
Google Analytics is notoriously difficult to learn and use compared to Parse.ly. Our dashboard is intuitive and functional, even for beginners. Authors get excited about data when they can actually see the effect their stories have on an audience.
“Data-phobia is a real problem for a lot of teams—most analytics platforms are not made for writers. Parse.ly is the tool that makes it fun, simple, easy, and not scary to get data. You want to start using it on a daily basis.”
David Grossman – CMO, Backstage
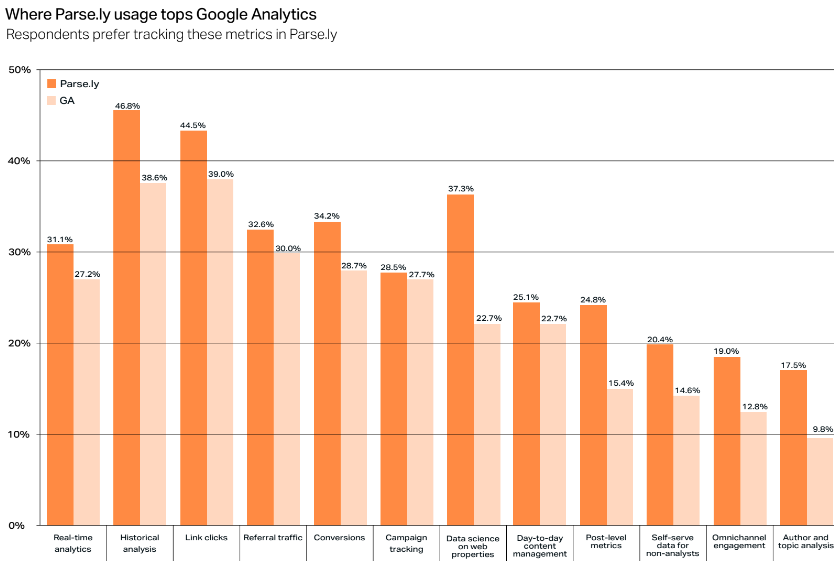
Our recent Content Matters 2023 Report spotlights 12 analytics tasks where Parse.ly users prefer our dashboard over Google Analytics. One of the most notable: self-serve data for non-analysts (like writers).
As the demand for content continues to increase, individuals and teams will profit by using data to make better, smarter publishing decisions. Increasing analytics tool usership can encourage people to make data-driven decisions that inform their writing strategy rather than relying on pure instinct. Plus, the more your team uses data to make decisions before writing, the less they’ll need to optimize post-publishing.
“It’s great for getting the whole office involved in ‘caring’ about the traffic. The journalists love seeing their stories create a spike, and when something old spikes, it’s like a canary in a mine letting you know there is an opportunity to create something new that fulfills a user’s need.”
Anonymous TrustRadius review
Whether you have each writer set up their own dashboard, create automatic reports for them, place a monitor with the analytics overview screen in your newsroom, or all of the above, once the entire team uses Parse.ly, it becomes a healthy, regular habit easy to stick to.
Use real-time data
For editorial organizations, real-time data is an absolute necessity to get ahead of competitors. And mentioned above, this also has to be a team effort. The more eyes looking at real-time data, the better chance of leveraging traffic spikes and trends to make the most of your content.
Many analytics tools claim to have live insights, but few actually offer more than a general view of traffic. Google Analytics, for example, lacks almost any real-time data, giving only current site users (both active and idle). Concurrents, and similar analytics metrics that show how many users are on your site at the moment, offer little actionable insight.
Instead, Parse.ly puts real-time analytics into context of historical data, which connects what’s happening on your site right now with past trends. Looking at real-time data this way offers more statistical significance and lets you capitalize on performance spikes while keeping your overall content strategy in focus. This is why Parse.ly is a better choice for media orgs.

Tip: Worried you might miss an important real-time traffic spike? Set up Parse.ly alerts to get instantly notified about trending content via your preferred channel (email, Slack, etc.) about specific posts, authors, sections, and more.
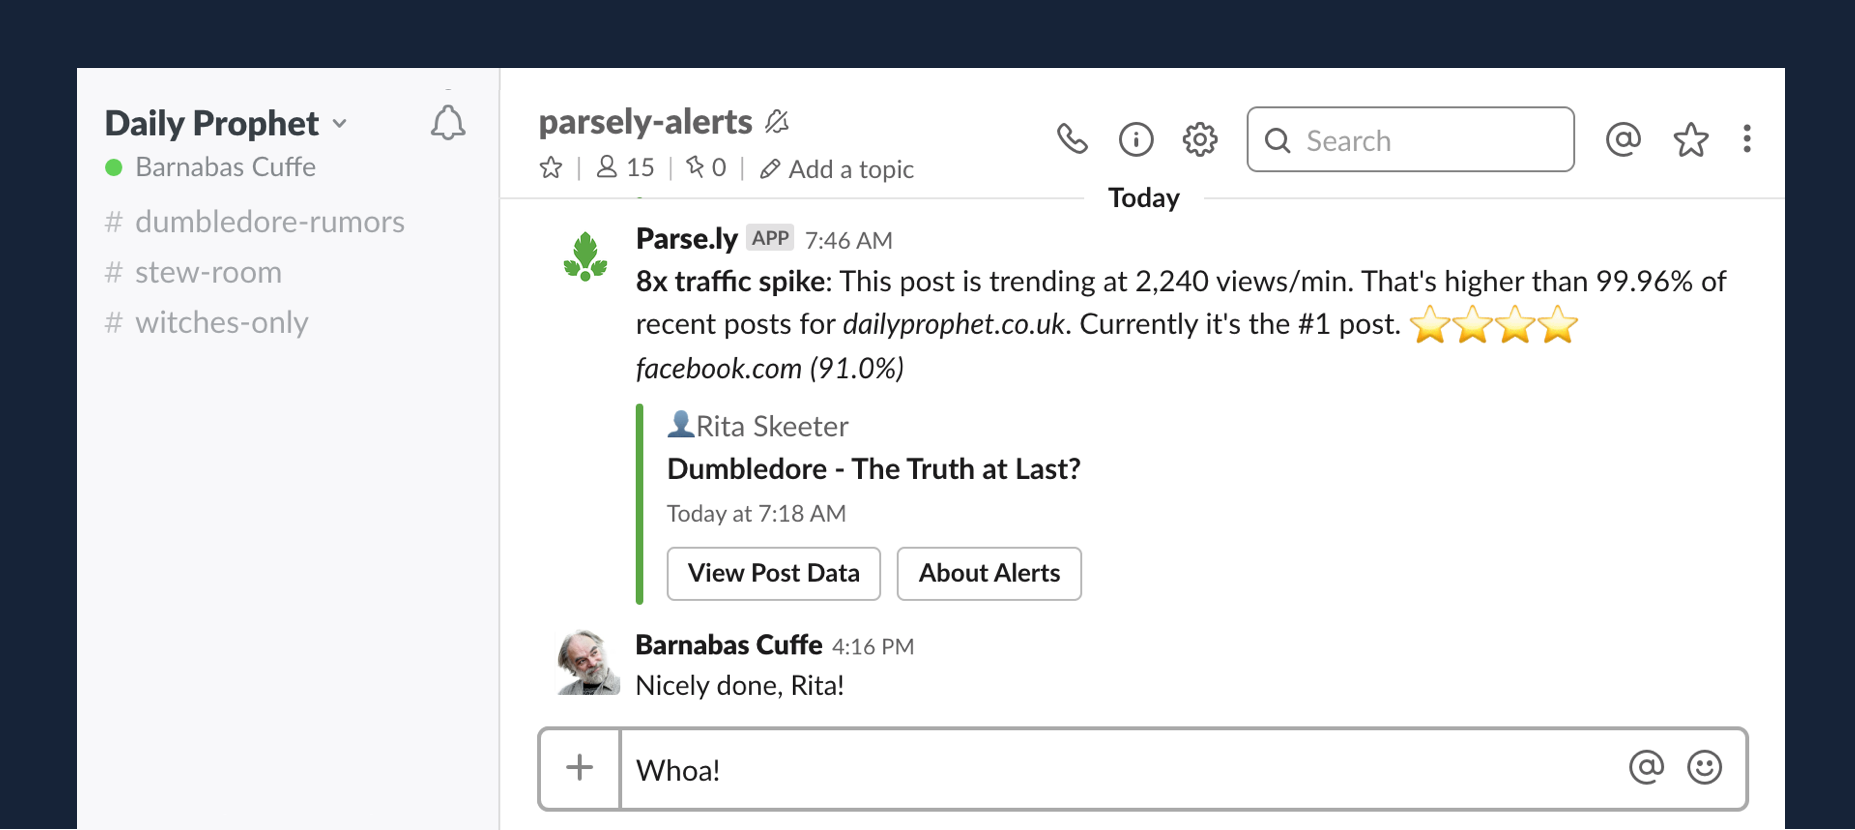
“It’s great to be immediately alerted, wherever I’m at. Knowing when a story is starting to perform really well allows our teams to jump on them to ensure headlines, photo and video placements, and links to other stories are in place.”
Adrian Ruhi – East Regional Growth Editor, Miami Herald
Align team goals
Staying focused on the end result is not easy, especially when trying to herd headstrong writers who want to do things their way. Parse.ly’s Goals feature is a great way to keep everyone’s eyes on the prize(s).
Admins can set up goals in a variety of metrics and KPIs, from pageviews to conversions. Using Goals aligns your publishing strategy in a visible and measurable way. The entire team can quickly see progress toward goals, then celebrate wins once they’re achieved.

“Parse.ly is a good solution to ensure different business units are referencing the same data points and share a similar understanding of our success/deficiencies.”
Kevin Wu – Principal Analyst, Vox
Team alignment customer use case
Since our entire team has started using Parse.ly daily, everyone is actually excited to monitor goal progress. We have a TV set up in the newsroom showing the real-time overview screen so we have lots of eyes watching for trending posts that we can capitalize on, whether it be another round of social circulation or reaching out for content syndication.
Instead of dreading going over data in team meetings, there’s now an air of friendly competition and an extra drive to create high-performing stories across the organization.
Parse.ly is “good news” for newsrooms
Parse.ly provides newsroom managers and editors with valuable insights they need to make data-driven decisions and help their teams publish the right content to the right audiences at the right time.
Want to see it in action?