How to Use Audience Data to Write a Great Post
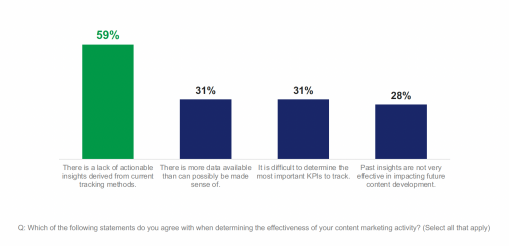
Data is a powerful way to translate your audience’s preferences into personalized and engaging stories and experiences. Analyzing audience data allows you to understand the recent transactions that have occurred between your audience and your work, and it allows you to take in all kinds of interesting information that will help you to engage your readers.
But have you ever stared at an analytics dashboard and thought, “Well, what do I with this?”
In a very meta-analysis, in this post, I’m walking through how our internal team uses our own Parse.ly dashboard to decide what to put into a future articles and blog posts.
Understand the status quo.
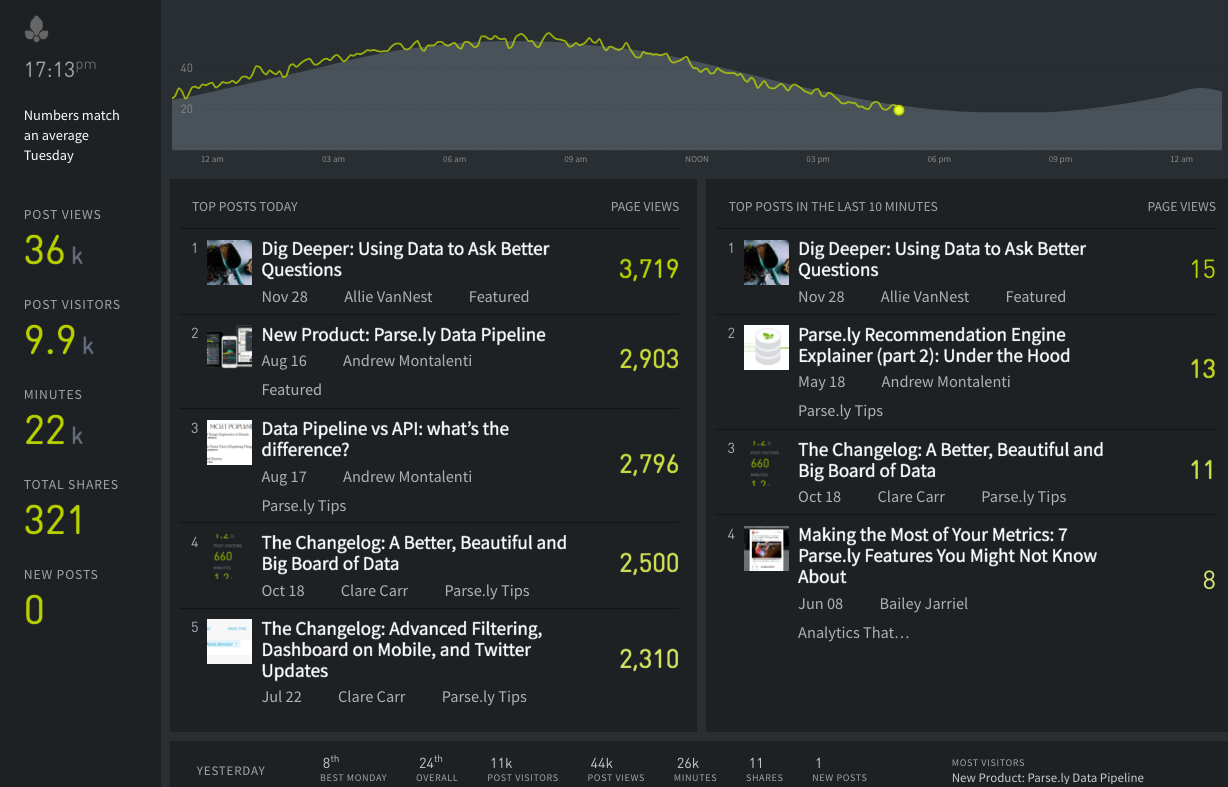
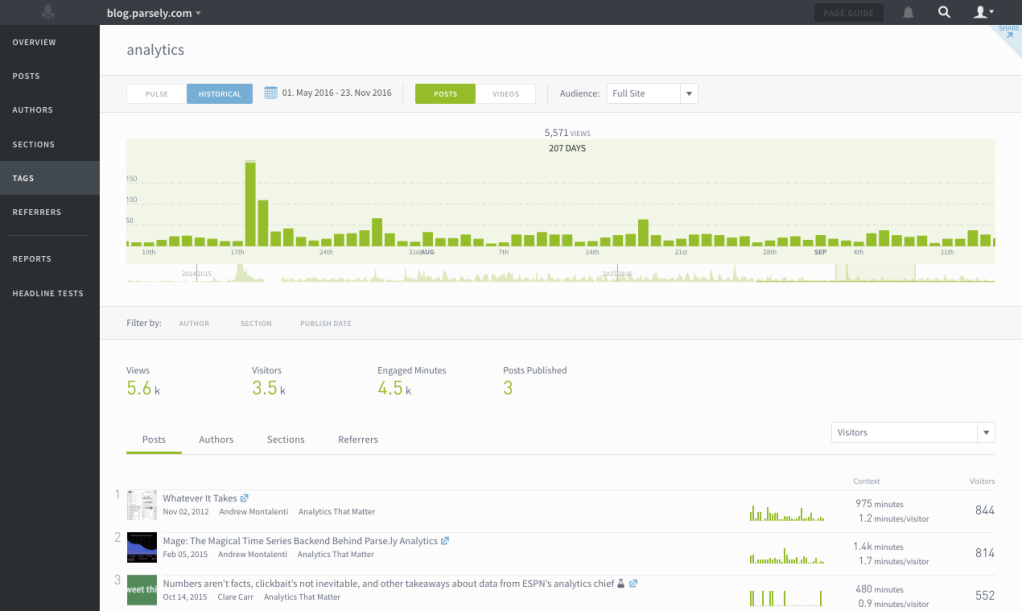
Before creating any content, we make sure that we understand what’s “typical” of our readers. We do this by keeping a constant eye on questions like: What content is the most popular right now? Where are readers coming from? How long are they staying on your post? What are they doing after they finish reading?
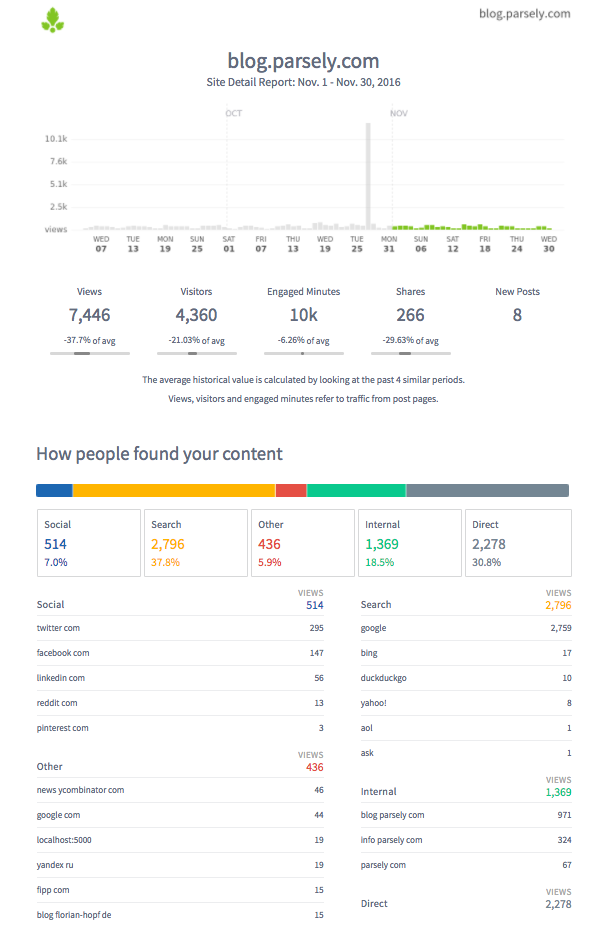
In addition to then being able to quickly spot when we have a spike or dip in traffic, we compare our status quo to our historical data, typically through reports that we go over as a team on a regular basis. Having context about what we can expect from our audience has helped us to get better at making predictions about what type of content, and what topics, will be successful in the future.
Understand your audience.
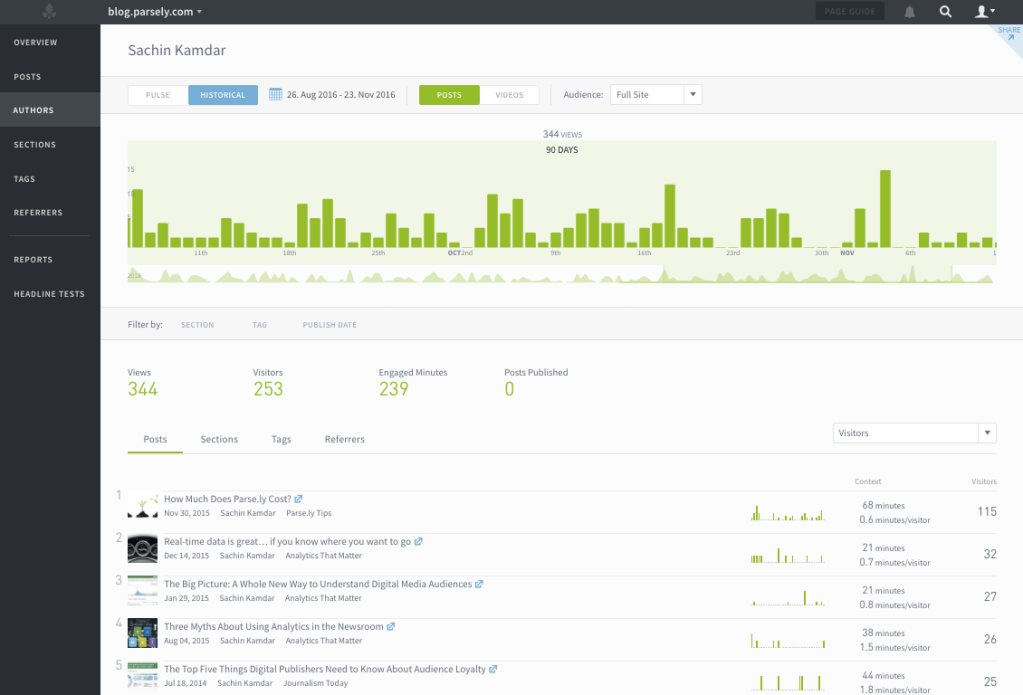
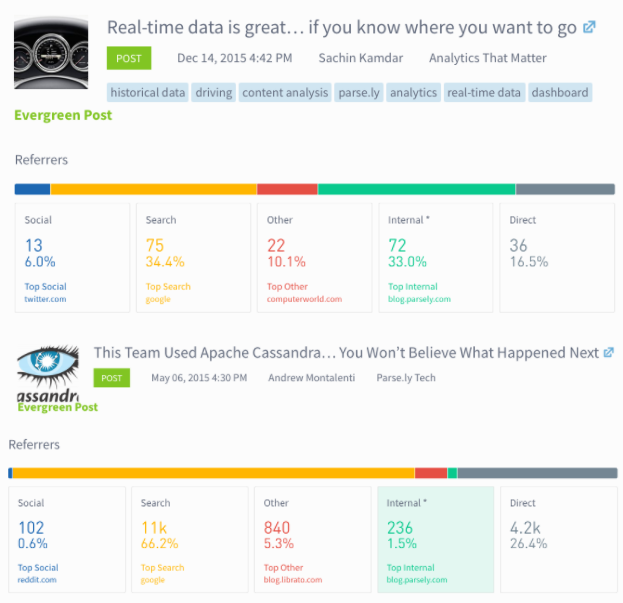
Our editorial strategy for the blog is to create posts that our existing audience will enjoy, share and learn from. To understand what you, our readers, are interested in, we examine how you respond to individual authors or topics, where you come from, and what you share after you read it.
Combine your findings with your experience
One insight we recently had was that our readers are less interested in our articles about general industry trends, and more interested in specific analytics best practices and how they can use analytics in their everyday work flow.
So guess what we wrote! This post about using the Parse.ly dashboard.
In addition to the dashboard, of course, we use feedback from readers on social media, conversations with clients, and our own experience. If you’d like to add to the conversation, let us know on twitter!