Content Analytics Dashboard
Better, smarter content strategy
Measure and optimize the impact of your content from first touch to last touch and everything in between—without needing a dedicated data analyst by your side.
Make data easy
Bring data to the daily habits of the creation process. Parse.ly’s intuitive dashboard presents content performance insights in terms that writers, marketers, and executives understand.

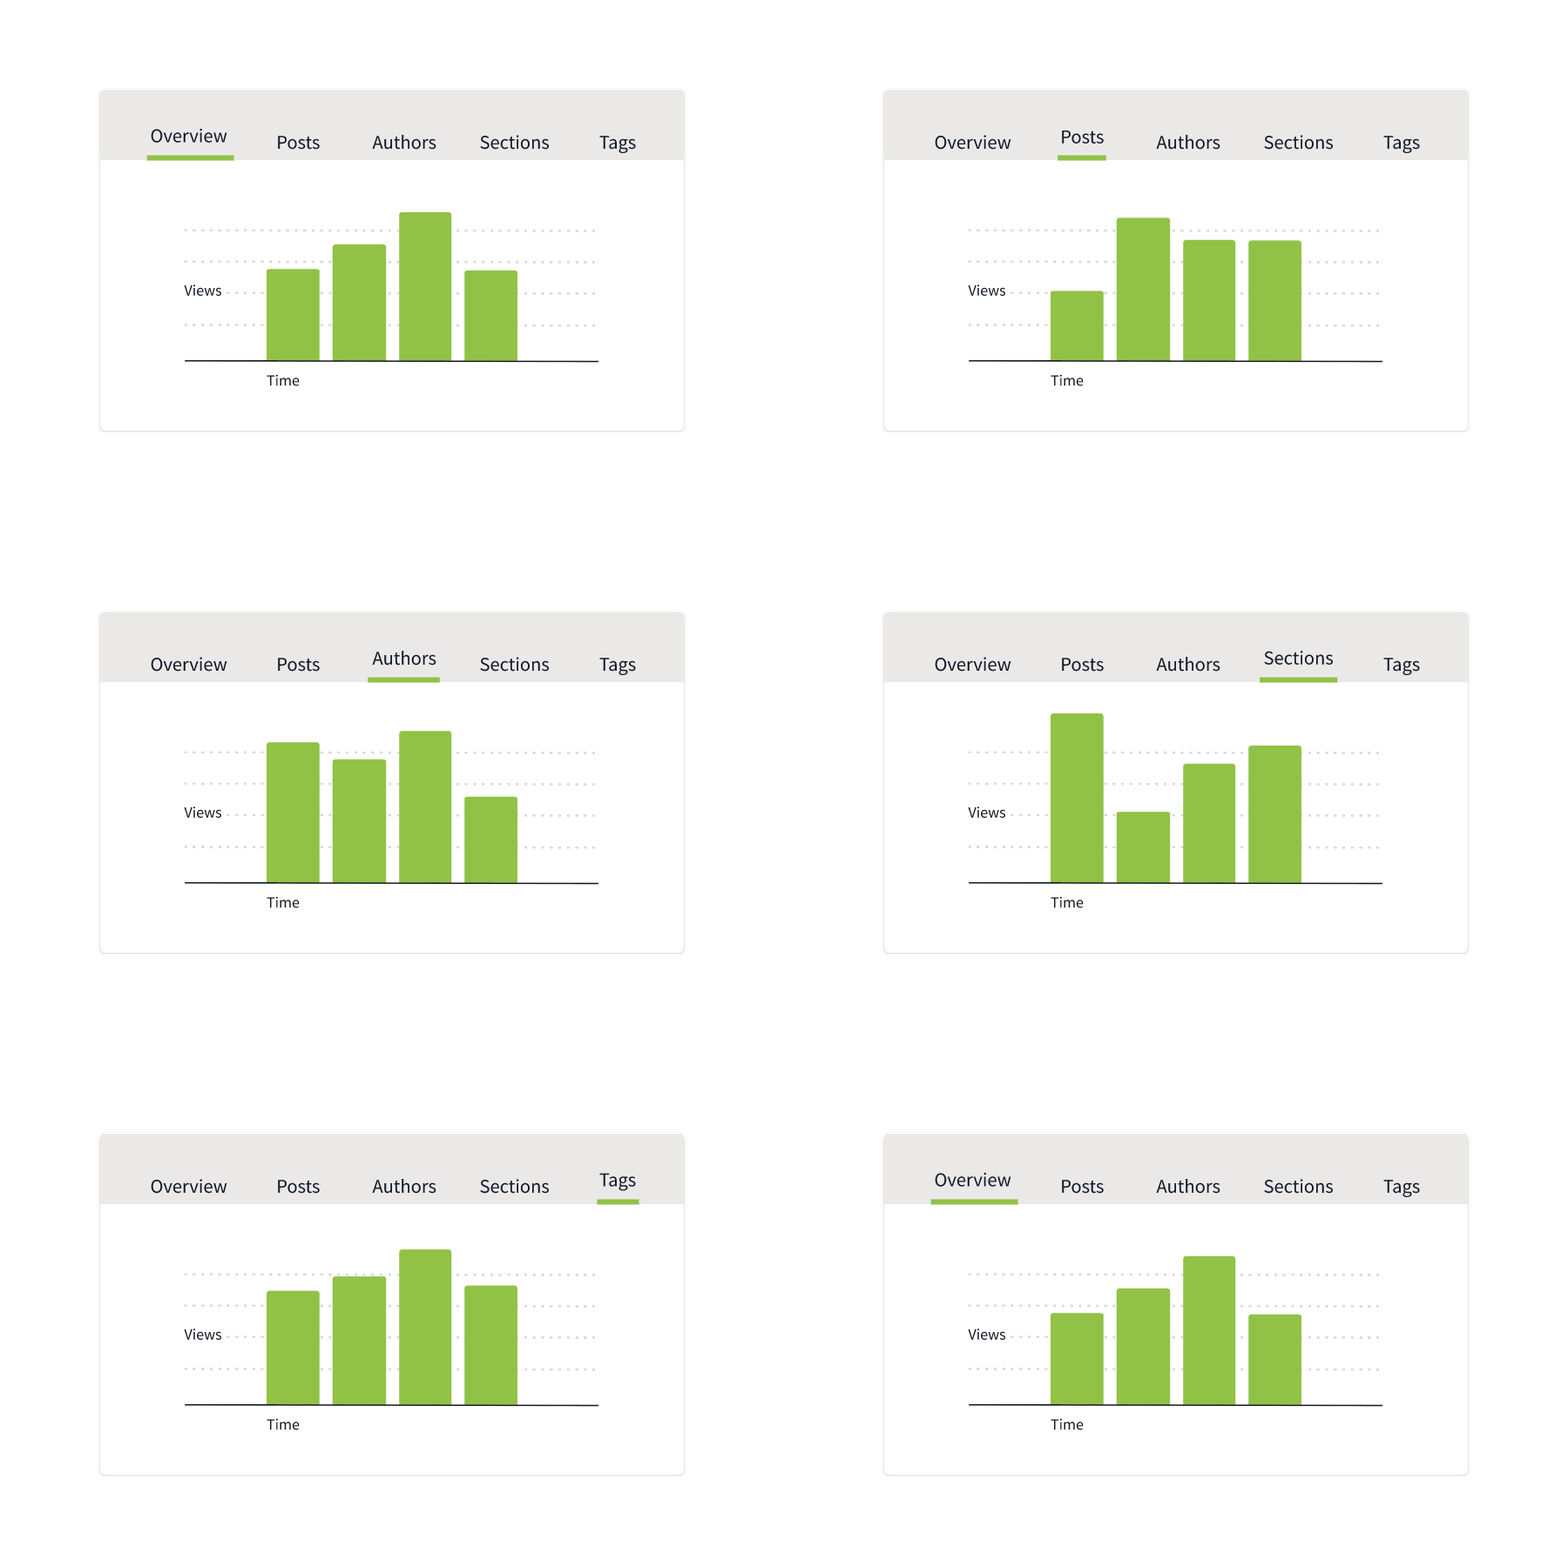
Overview
Customize your home screen to at a glance the metrics that matter to you.
Topics & Tags
Analyze your content by topic, using tags pulled from your CMS or generated by our AI-powered Smart Tags.
Authors
Track author performance—maybe there’s something an individual is doing that’s working, and the rest of the team should follow suit.
Campaigns
See which campaigns are most effective. Parse.ly automatically pulls in all your UTMs.
Channels & Referrers
Segment performance via which channel is engaging with your content—whether it’s social, search, web, apps, and more.
Sections
Compare your content depending on the sections of your website it lives in.
Word Count
See whether content of various lengths is most effective.
Publish Date
Easily surface all the content published during a given time frame.
Video Analytics
Track whether your audience interacts with your videos, and if videos improve your content.
We chose Parse.ly because it’s so user-friendly, especially for an editor who wants to be able to report on how their content is doing right away.
Morgan Gibson
Senior Manager of Digital Content

Focus content strategy
Stop optimizing for high-click, low-value audiences. Use advanced metrics beyond the page view in order to understand the true outcomes of your content.
Historical Data
Understand content trends over days, weeks, months, and years—so you can work smarter, not harder.
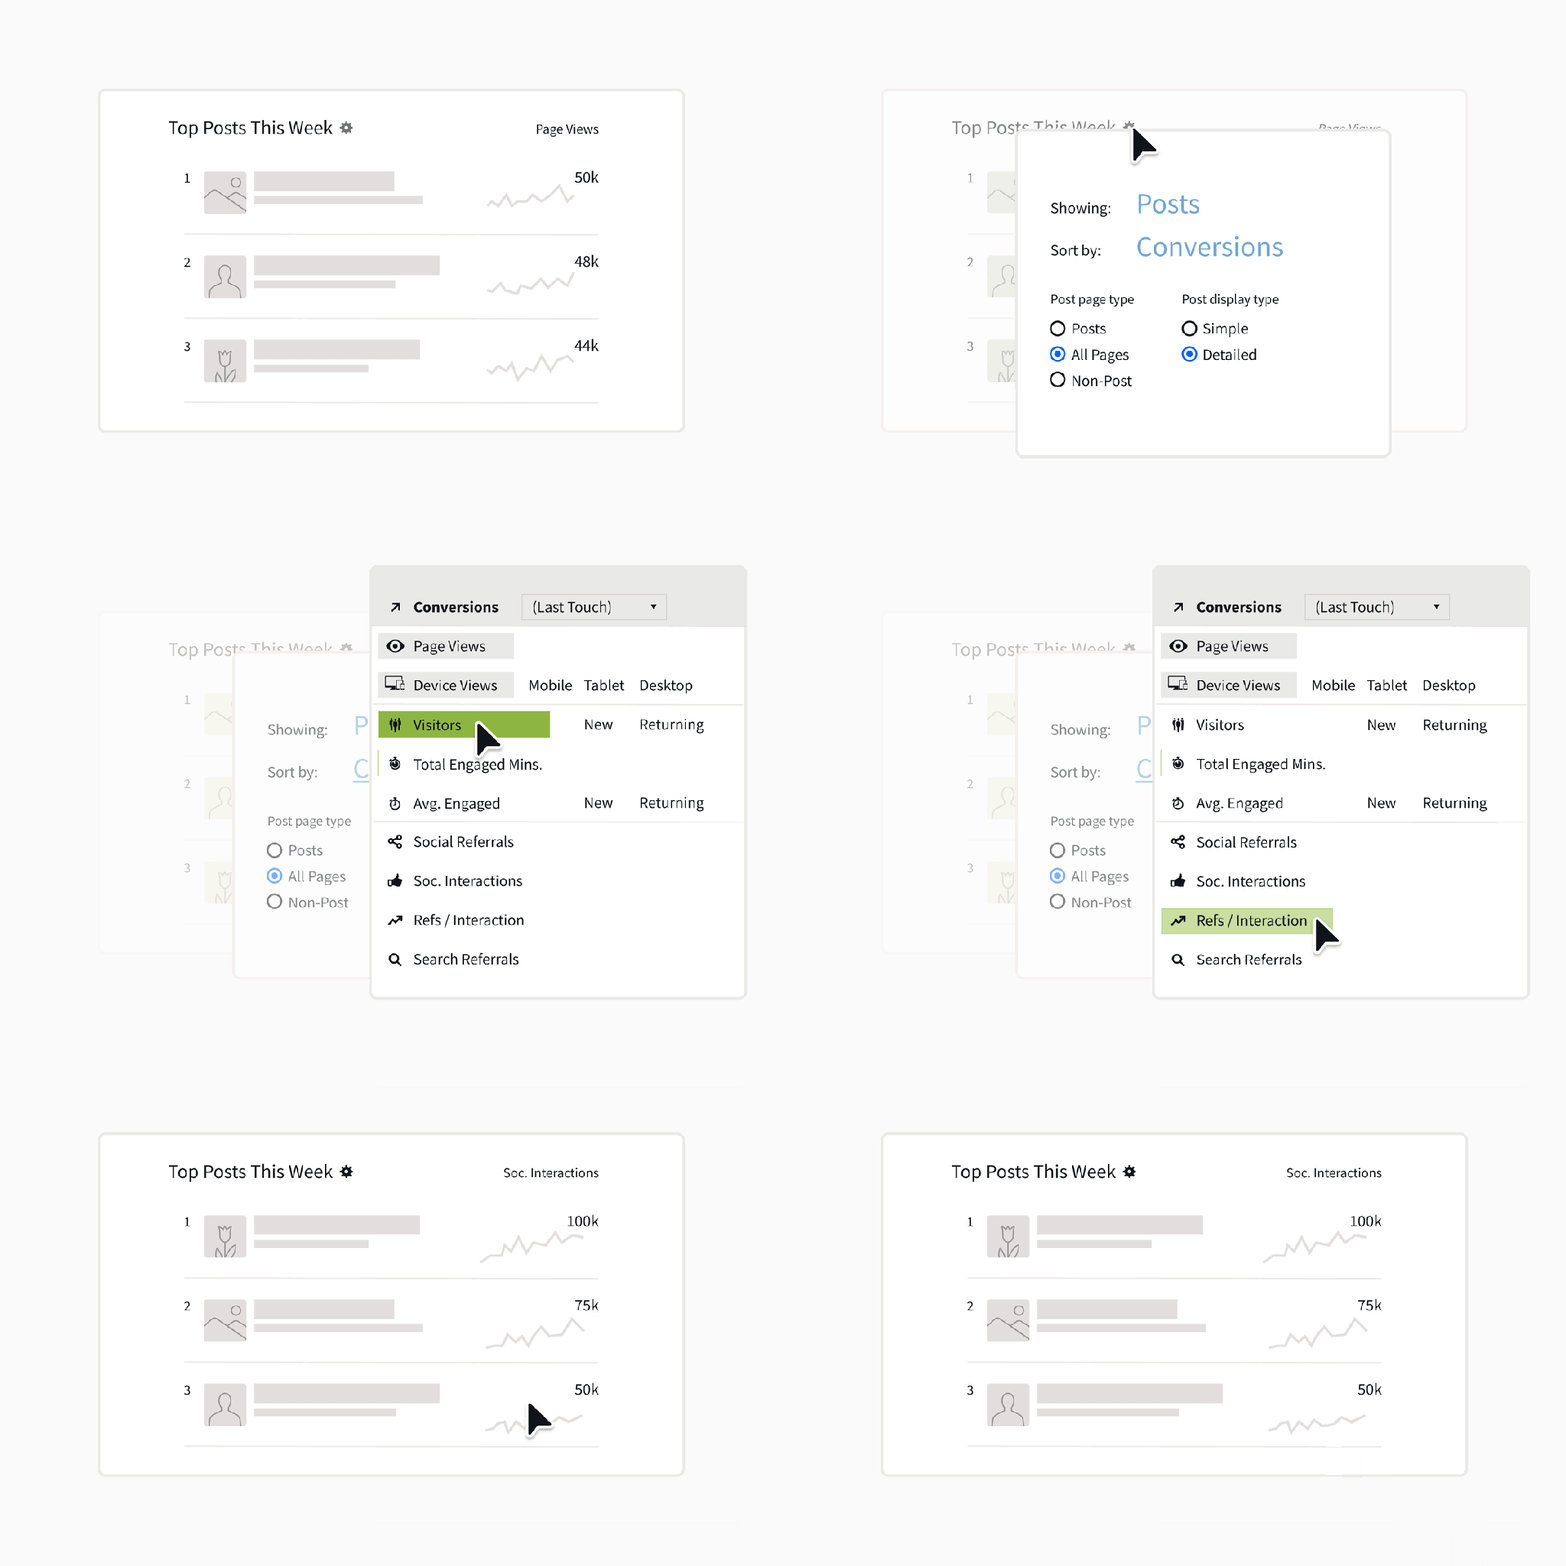
Conversions
See what content drives actions. Use the linear conversion model to give credit to content read many clicks before they converted.
Engaged Time
Page views only tell you so much—engaged time is better. See how long customers actually spend reading your content.
Audience Segments
Combine your metrics with audience segmentation to understand the difference between readers, customers, subscribers, and more.
New & Returning Visitors
See what content adds new readers to your audience—and see what content creates the most loyal return visitors.
Comparisons
Easily compare the “before and after” impact of your efforts, to see if the work you did made a difference.
Recirculation Rate
Understand what content keeps people on your site, and where they click next.
Groups
Bring your expertise to your data by grouping different aspects to analyze them together—Tags, Authors, Referrers, and Campaigns.
Search Traffic
See which content produces search results, and refine your strategy.
Keywords
Bring keyword performance to the whole team, so everyone can be an SEO expert.
Google Discover
Segment out Google Discover traffic to maximize this channel.
The ability to break things down by region—especially when cross-referenced against Parse.ly’s range of metrics like users, engaged time, social referrals and interactions—is priceless.
Adam Blenford
Managing Editor of Digital in Europe
Act in real time
Participate in conversations as they happen, instead of reacting afterwards.

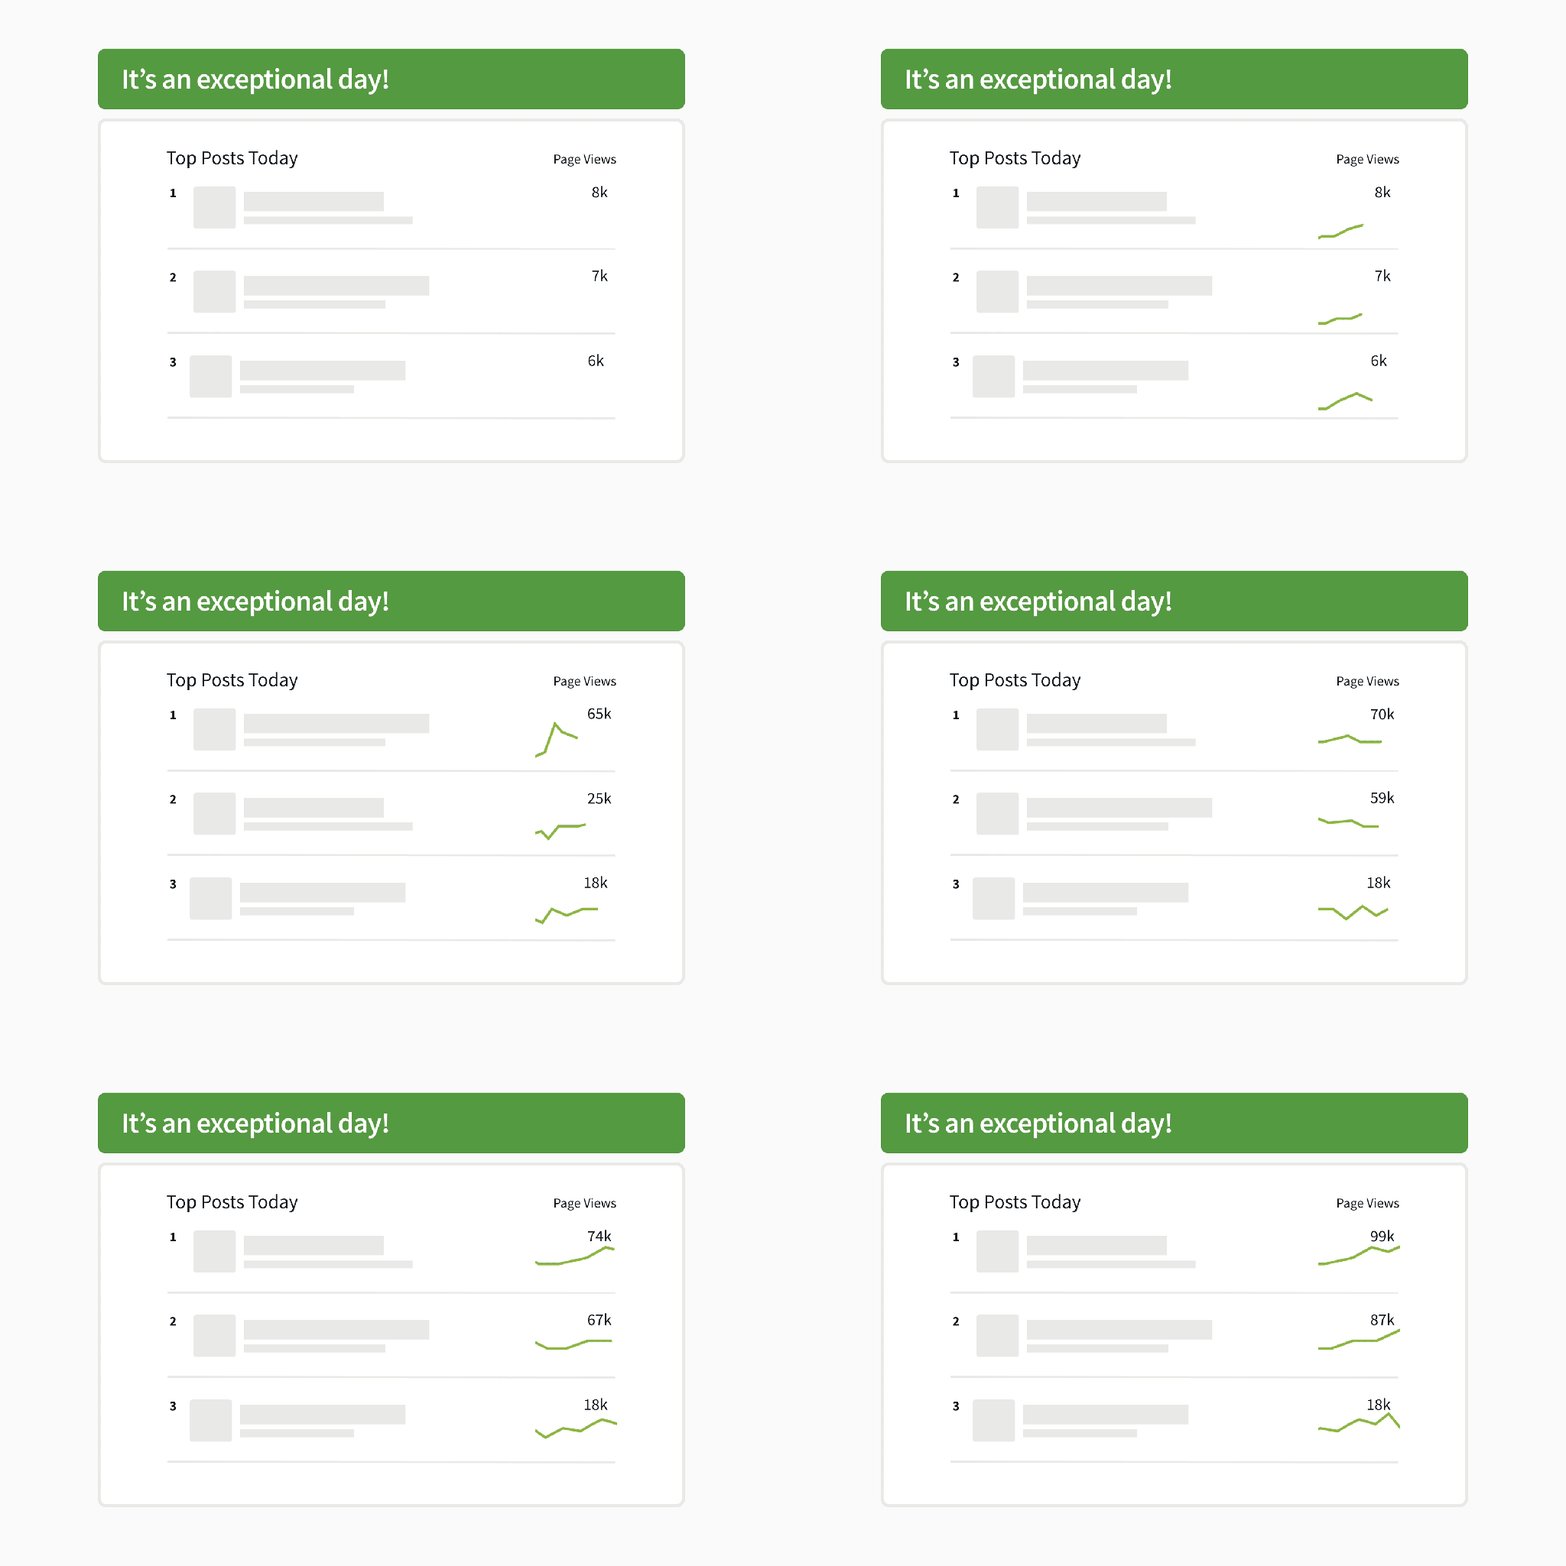
Real-time Data
Parse.ly updates instantly. Maximize the results you get from any spike in attention.
Social Interactions
See the Tweets (and more) about your content, all in one convenient place inside Parse.ly.
Social Referrers
Understand which social platforms are sending the most traffic to your content.
Alerts
Get alerts to your inbox or on Slack when traffic surges.
Prove content ROI
Make it easy to prove the ROI of content to the business, so you can build a predictable revenue engine with your team.

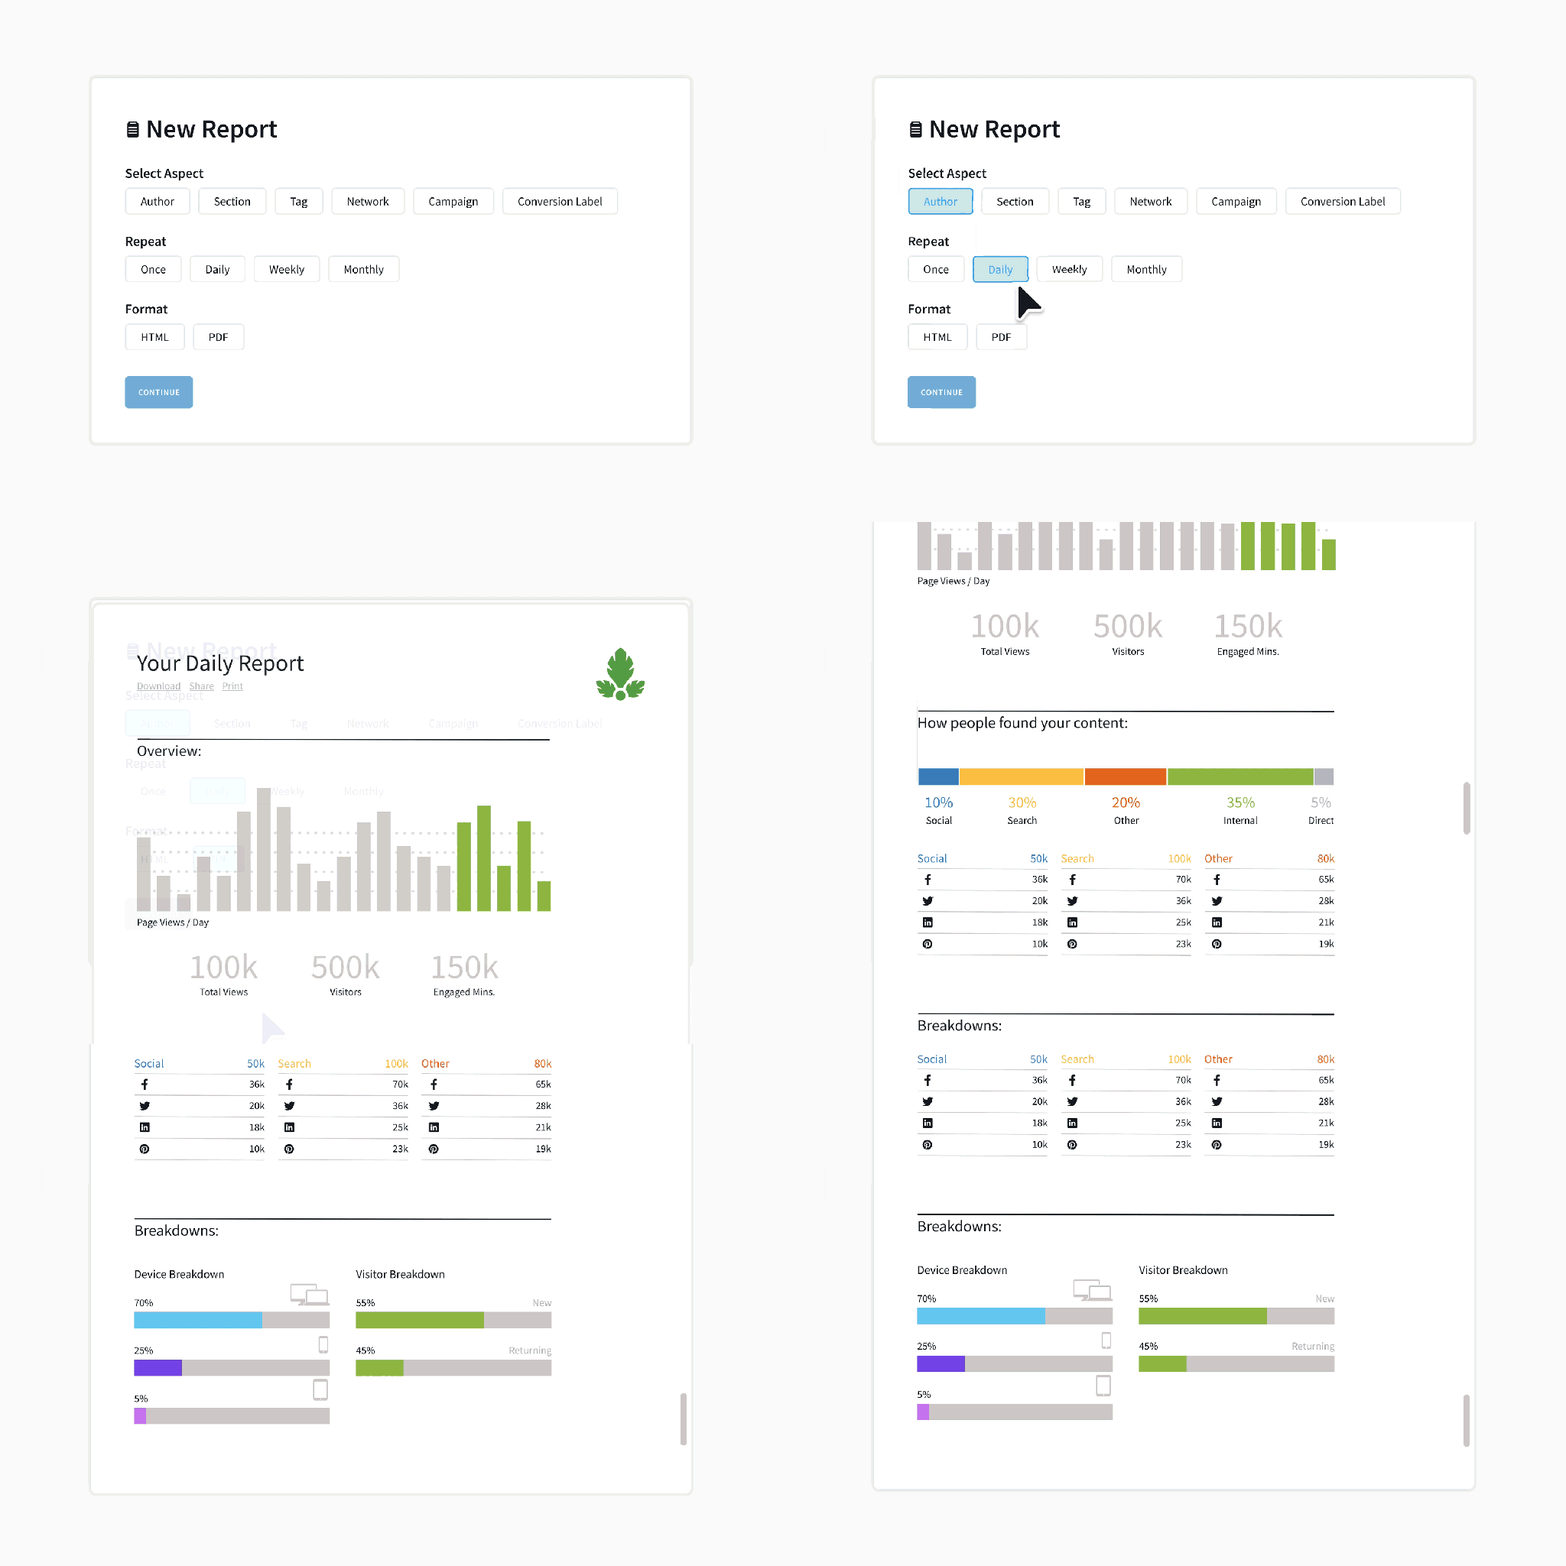
Reports
Use ready-made or custom reports to show the value of your content. Deliver data via HTML, Email, CSV and XLSX.
Benchmarks
Quickly understand whether content is performing above or below average.
Goals
Put your top-level KPIs in one easy-to-view location, so your team can focus on what matters.
Sharable links
Share content data with those who don’t have a login to the Parse.ly Dashboard.
Frequently asked questions
How does Parse.ly analytics boost content marketing?
Parse.ly is an analytics tool built for content teams. Parse.ly makes it easy for content marketers to know which topics and pieces of content are driving real results for your business. Instead of having to rely on analysts for answers, content marketers can now find out for themselves which topics they should write about.
How do you analyze content marketing with Parse.ly?
For every piece you publish, there’s data to tell you how your audience is responding. Writing content can be deeply personal—and even today most content is still written because “it seemed like a good idea.” At the end of the day, however, content is written for the impact it creates on the business. Analytics for content marketing helps teams identify what content is creating the impact that they need, so they can work smarter, not harder.
Parse.ly helps surface these insights in a format that writers and creators understand, so they don’t need to turn to the analysts in order to become data-driven. Keep an eye on which direction your core KPIs are heading as you execute your content strategy, expand the content that works, and iterate.
With an at-a-glance breakdown of the traffic of days, weeks, or months across multiple channels, marketers know what pieces of content are performing. Track 30 unique attention metrics to understand how readers are interacting with your content. Parse.ly tells you which channels, campaigns, referrals, topics and more are creating customer conversions that move your business forward.
What are analytics in marketing?
Marketing analytics is the study of data using technologies and processes to determine the success and ROI of marketing efforts. Being able to track and closely monitor how audiences interact and engage with your content is vital. With Parse.ly you can easily identify opportunities for improvement without the hassle of a large learning curve? Get the answers you need to be data-driven, without having to ask an analyst for some number-crunching.
What are the types of marketing analytics?
Marketing analytics vary based on what type of business you run, and what channels you use to attract and retain customers. Each channel includes its own set of metrics—for example, web, email, social media, and in-person events all have different objectives and means of measuring them.
All marketing analytics eventually build down to:
– How does your business create revenue (B2B, B2C, ad-driven, online store, subscription…)
– How do you create customers (which marketing tactics lead to new customers)
– How many customers did you create
– How much does your average customer spend
– How much did you spend to create these customers
Here are some of the common marketing channels, and the metrics they care about:
– Email analytics: Views, unique visitors, campaign impressions, paid ad performance
– Social media analytics: Audience size, mentions, shares, likes, impressions, click-through-rate
– Web analytics: Views, unique visitors, campaign impressions, paid ad performance
– Content analytics: Content conversions, leads captured, subscriptions, purchases, views, engaged time, social interactions, and more
Parse.ly tracks your content as it is deployed across all your channels, and helps you identify which content leads to the engagement and “conversion events” that create revenue for your business and connections with your customers.