On-Page Analytics: Now Available Through an Overlay
Everyone tries to move fast when it comes to digital media, especially when it comes to making decisions based on audience analytics. One way to do that better? Make sure that you’re seeing the latest data at all times: right on your website.
Today, we’re pleased to announce that Parse.ly clients can now access analytics about a post’s real-time audience engagement directly through an on-page overlay that lives on homepages, section pages, and within the on-site article.
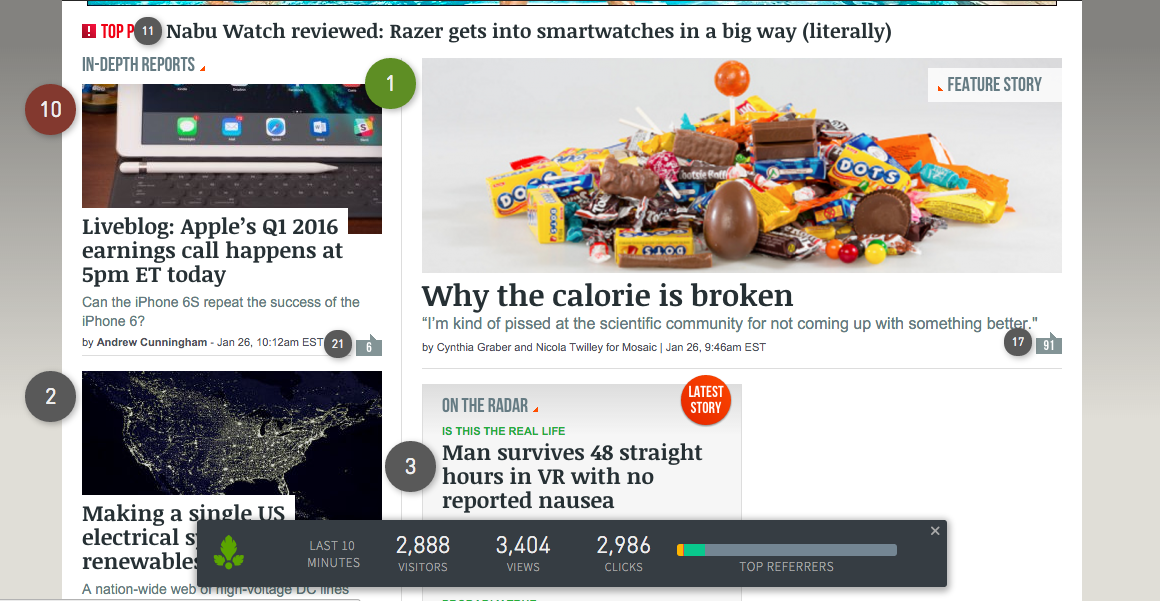
The overlay is available through a bookmark that can be activated in your browser to add contextual information in the form of “badges” to the current page of your site and an overview of all views, visitors, and referrals to the homepage.

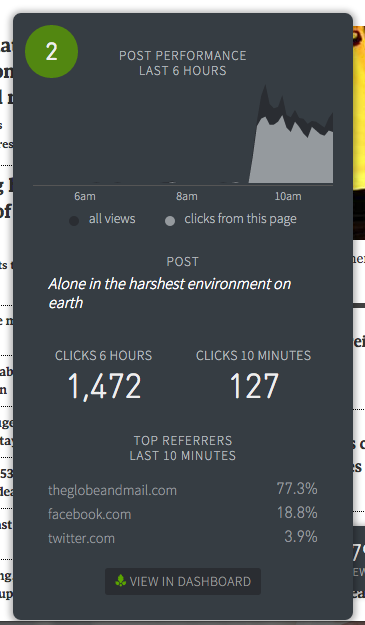
Each badge represents the current ranking of a particular post based on the number of readers it has sent to the corresponding article. See detailed analytics about all traffic to the specific article by simply hovering over the associated badge:

With the overlay enabled, article pages also now include an on-page record of total views, visits, and referrals for the last ten minutes. To see more, click the Parse.ly logo to jump right into that article within your Parse.ly dashboard.

Please note, that with this release, we will be deprecating our existing Chrome Extension, as the overlay works within all browsers. If you use the Chrome Extension frequently, make sure to switch over!
Homepage Editors: Consider the Position of Posts
Homepage editors have some unique needs when it comes to analytics. They’re the ones responsible for making sure that readers landing on the homepage see the latest and greatest stories. Not only do they need quick access to the data, but they need to understand how other factors come into play – in particular, location of a story on the homepage.
For teams that need to understand this granular level of homepage performance, Parse.ly is also now offering an optional version of the overlaid analytics that includes information on how the location of an article affects the audience’s reaction: position tracking.
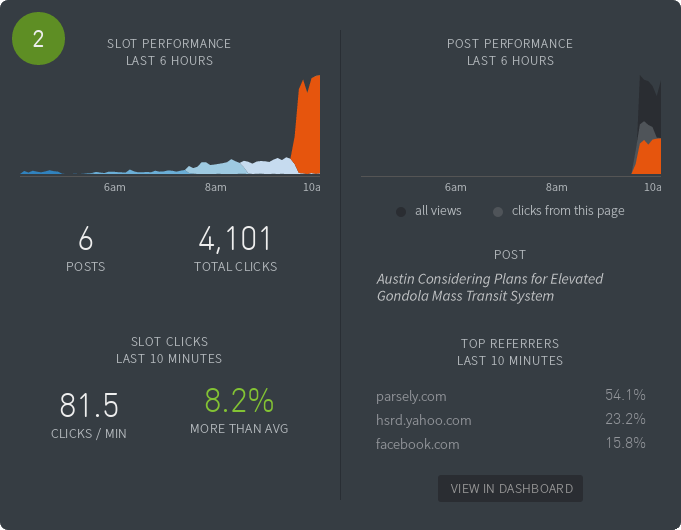
When position tracking is enabled, the homepage badges enable users to understand how a particular location, or “slot,” on the homepage is performing. Hovering will then allow publishers to see not just the performance of the post (on the right, in the image below) that has been in that slot over the past six hours, but how all of the posts in the slot itself have performed over the past six hours.

The different colors in the left section represent different articles that have populated that slot over the time period shown. Hovering over any of those colors in the graph on the left, will update the information on the right to show the specific articles’ data.
Make Homepage Decisions Based on Slot Performance
In the example above, six posts have occupied this particular location in the last six hours. The most recent article (in orange) has resonated the most with readers — well beyond the other articles in the same position. Should this article be promoted elsewhere? Did a recent change to the headline or image cause this? These are questions that can start to be answered by having this information.
Quick Access to Post Information
Being able to see the information about the post within this badge can also help answer these questions: the chart depicts the history of all traffic to the page in question (shown in dark grey); clicks that came specifically from this page (shown in lighter grey); and, finally, clicks from exactly this location in the page (shown above in orange). The referrers distribution information at the bottom of the screen provides context about whether the post has gone social or attracted attention from search engines.
Overlay analytics are currently available to all of our customers, activate your overlay here. Slot performance tracking is a premium feature that is available to those in the analytics and data tiers. Please contact your Account Manager with any questions about access or set up!