How to quickly adopt Parse.ly Data Pipeline as the ultimate raw data API
Note: Parse.ly launched Data Pipeline in late 2016, and evolved its offering over the course of 2017-2019. This post was originally published upon launch but has been updated to reflect its modern support several times since then.
Data layers, data lakes, data warehouses. It all feels a little overcomplicated, doesn’t it?
At Parse.ly, we like to ask ourselves, “how can we make data and analytics easy — rather than a chore?”
That’s what we’ve been doing for years with our awesome real-time content analytics system, which are now trusted by the staff of over 4,000 of the web’s highest-traffic sites, including TechCrunch, Slate, and The Intercept. That’s what we’ve been doing with our powerful HTTP/JSON APIs for developers, which now get over 2.5 billion API calls per month, powering site experiences for the likes of Arstechnica and Gannett.
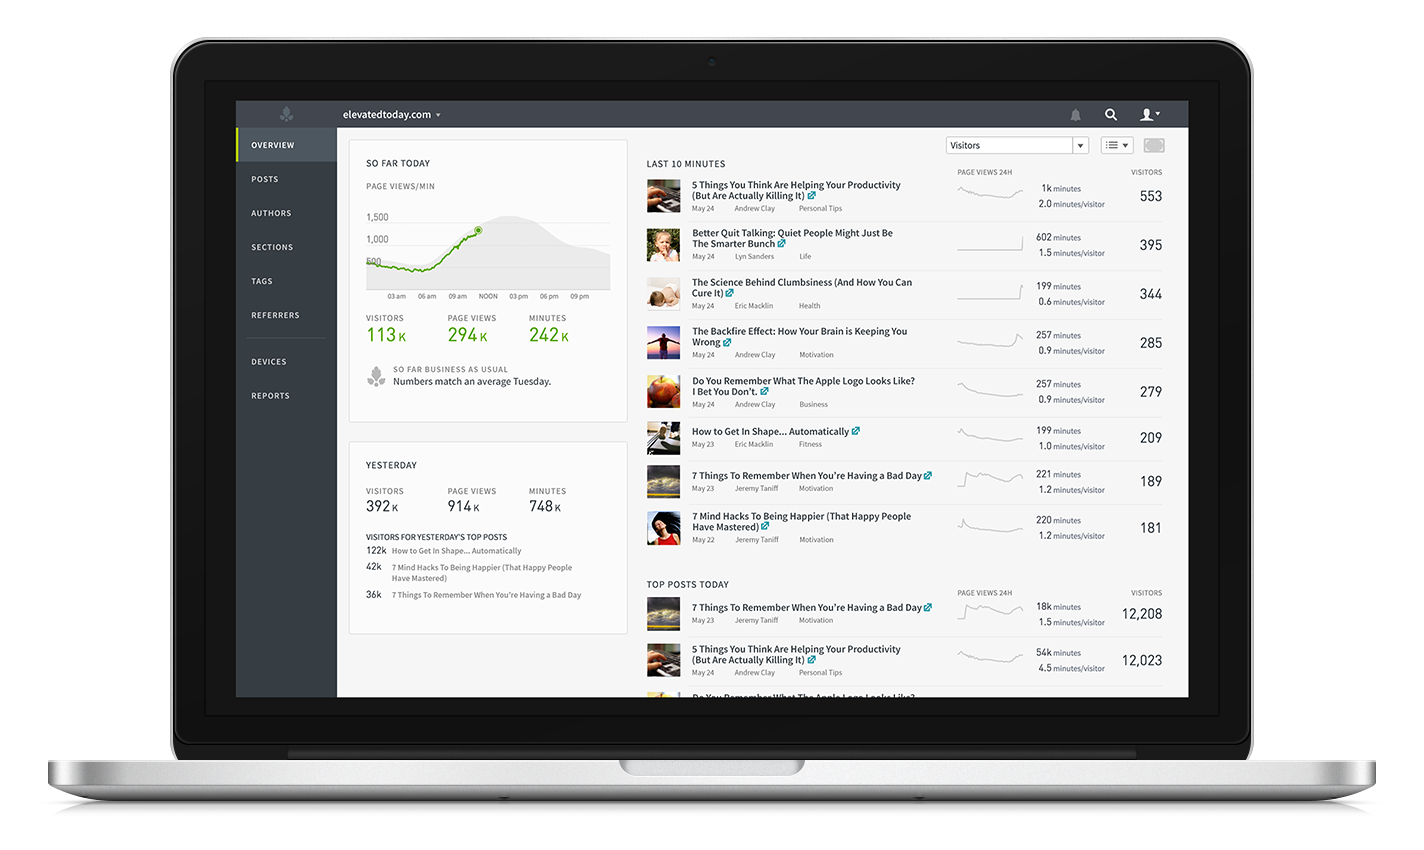
Parse.ly’s real-time and historical dashboards are trusted by over 400 companies to deliver live insights about over 1 billion monthly unique visitors.
Similar to the world of analytics dashboards and analytics APIs when Parse.ly got started, the world of analytics data warehouses (aka data lakes) looks scary and unapproachable. But it doesn’t need to be that way.
Rather than backing down from the challenge, we decided to tackle it head-on. How could we design a modern and robust platform for unlocking the value of user and content interactions? It would need to be a platform built for the modern developer: centered around simplicity; compatibility with the public clouds; friendliness with open source tools; and, most of all, rock-solid reliability.
In short, how could we deliver you the raw data about your sites, apps, and users, with minimal fuss and maximum flexibility? How could we provide full support for not just the raw pageview and engagement data that powers our content analytics system, but also for any number of custom attributes and custom events that you might use to link that data up with your own systems? That’s what we sought to tackle with Parse.ly Data Pipeline.
There’s an explosion of open source and cloud tools available for analyzing raw data and drawing insights. But to draw out those insights, you need to get your hands on that raw data, without building your own complex data collection infrastructure. Providing easy access to that data — in a way that fits neatly into existing open source and cloud tools — is precisely what we’ve done with Parse.ly Data Pipeline.
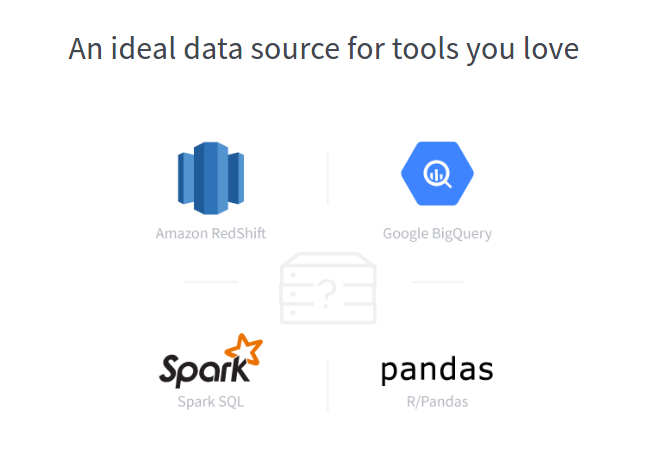
Building on the analytics infrastructure expertise we’ve developed by processing over 100 billion user events per month, Parse.ly shipped its original support for raw data warehousing in late 2016, and continuously refined that experience from 2017-2019 and beyond. Thanks to this engineering work, developers can “flip a switch” and get real-time and historical access to raw data, which then provides the ultimate API for content analytics insights.
Raw Data is the good stuff
It’s pure. It’s loaded with important information about your website and app visitors. It’s highly customizable. It’s not limited by one-size-fits-all dashboards or APIs. It’s a building block, a data foundation.
Any good data scientist, analyst, or engineer knows that there is a ton of value in raw user interaction data. They can use that data to improve your business and delight your users. But for far too long, it’s been way too difficult to collect, enrich, transform, and store.
But if you’re already using Parse.ly for its content analytics system, you don’t need to reinvent the wheel. Parse.ly’s Data Pipeline makes raw data available to anyone, instantly.
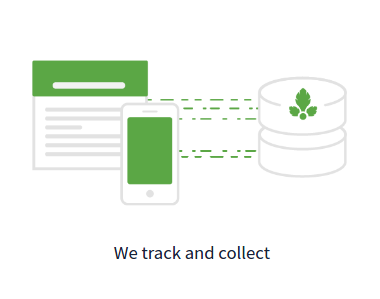
You can leverage our battle-tested SDKs, spanning site/page engagement with JavaScript, to video engagement tracking, to native mobile trackers, to distributed content trackers in Google AMP and Facebook Instant Articles, and even including Apple News real-time data that we ingest via a special partnership with Apple.
We also have server-side APIs, and APIs for custom event tracking, conversion events, and custom data attributes.
Why leverage our infrastructure, rather than build it yourself? Well, you get instant access to a global fleet of cloud servers that know how to capture and log events from any of your users’ devices with extremely low latency. The raw events are routed to highly-available stream processing systems that Parse.ly manages, which begin processing them within milliseconds.
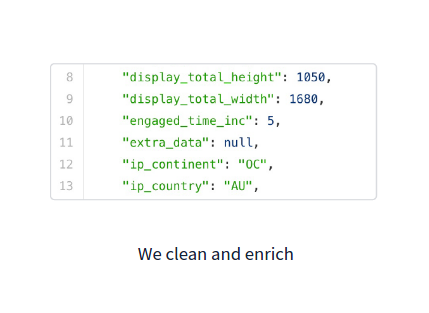
Parse.ly’s stream processor not only validates and cleans the data — it also enriches it. Our base Data Pipeline event schema has over 50 standard enriched attributes per event, all automatically inferred from lightweight tracking events. This includes geographic regions/locations, device/OS types, traffic sources/categories, session-based attributes, and page metadata.
But here’s the best part: you own it all

Rather than trying to sell you a hosted data warehouse, forcing you to roll your own data collection infrastructure, or offering you some complex managed offering over Redshift, BigQuery, or Snowflake, Parse.ly just delivers you the enriched data, and lets you do whatever you want with it. How cool is that?
- Durable storage and historical access is handled by your very own Amazon S3 Bucket. Data syncs into your S3 Bucket every 15 minutes, and is stored in a clean, well-documented, gzip-compressed JSON format. As of late 2019, a Google Cloud Storage (GCS) bucket is available in private beta for Google Cloud users.
- Streaming events and real-time access is handled by your very own Amazon Kinesis Stream. Data flows into your Kinesis Stream in your AWS account in real-time, with end-to-end latency measured in seconds. Events are written in a matching JSON format.
Parse.ly provisions all this infrastructure automatically. You don’t even need to be an AWS user to make use of it. Some customers are using these managed endpoints from Google Cloud Platform, from Microsoft Azure, from other cloud/VPS providers, or from their own on-premise data centers!
Parse.ly ensures data is automatically and continuously written to the right place. So, within minutes, you can load the data up in the tools you love.
Leverage our official code samples in shell/CLI and Python to get started. Or, clone our open source Python project on Github to get the data to convenient analytics engines like Redshift, Athena, BigQuery, and Apache Spark.
How it all fits together
Our goal with Data Pipeline was to prevent the need to build and maintain your own in-house data collection and analytics infrastructure, and instead be able to reuse the system Parse.ly has been running in production — and at massive scale — for real-time data collection.

In this diagram, you can see how Parse.ly fully manages all the components marked in green, while you, as the customer, control everything marked in blue. This means you get to benefit from all the engineering work of the green components, while still retaining full control over ingestion code, schemas, SQL, materialized views over your data, complex joins, and so on.

It’s the best of both worlds.
Raw Data unlocks queries and segments
Alright, so that developer experience sounds pretty sweet. But, I bet you’re wondering — what can I do with this data? Glad you asked!
Parse.ly’s dashboard supports a slew of metrics out-of-the-box, such as views, visitors, time, and shares. However, our event analytics pipeline is generic, and can support custom events of all kinds. Interested in measuring scroll depth, on-site share actions, content recommendation clicks, viewable ad impressions, or newsletter subscriptions? Each of these can be modeled as a raw event, sent to Parse.ly, and delivered via the Data Pipeline. What’s more, these events are automatically associated with the visitor and session, and thus allow for complex single-session and multi-session visitor analysis.
What’s more, each event includes a wealth of information that Parse.ly does not make much use of inside its dashboards. This includes time-of-day information, detailed visitor geography (at city/postal code level), query parameters (for paid/custom campaign tracking), user session information, page metadata, and more. By having access to this data, your team can build custom analyses that make sense to your own business and to your users or visitors.
As of late-2019, we also support a number of official support for Content Conversions, where where Parse.ly’s content analytics system will automatically apply a number of content attribution models to provide insight on the content leading to leads, email newsletter signups, and paid subscriptions. All of this data also flows through to our Data Pipeline automatically, and is documented on the tracking side in our Conversions Standard and Conversions Premium techdocs.
Raw Data allows for arbitrary SQL
Sometimes you have analyst teams who know how to write SQL and would love to ask questions against a subset of user data. SQL access is one of the primary drivers for our current Data Pipeline customers — even though we don’t directly provide it.
In the past, this was very hard to do since most SQL engines could not handle large-scale analytics data well, but this has changed with the public availability of Amazon Redshift, Amazon Athena, Google BigQuery, and other tools, such as the open source Apache Spark SQL.
Parse.ly’s Data Pipeline is specifically optimized to make it trivial to bulk load Parse.ly’s data into these tools — for example, our JSON formats are tested to work with automatic JSON conversion/import tools. Thus, with a couple of commands, you can not only fully own your analytics data — you can also ask any question of it!
For example, here’s a sample query one could write against an Amazon Redshift database that has been set up with Parse.ly’s raw data, without customizing our base event schema at all:
SELECT meta_title AS title, url, COUNT(action) as views
FROM parsely.rawdata
WHERE
action = 'pageview' AND
ts_action > (current_date - interval '7' day)
GROUP BY url
ORDER BY views
This would give back a table that might look like this:

This is showing the top posts (on this blog!) over the last 7 days. The benefit of a query like this is that you can customize the query however you like by customizing the SQL. For example, our dashboards and APIs have no notion of visitor geography, but our raw data includes an ip_country field, describing the visitor’s country of origin. Filtering out all non-US traffic would be trivial; you’d just add:
SELECT ...
FROM parsely.rawdata
WHERE
... AND
ip_country = 'US'
to the SQL query. Done! That’s the power of SQL.
Raw Data enables Business Intelligence
Via their integration with the cloud SQL engines mentioned above, a number of Business Intelligence (BI) products are on the market that can assist you with building live-refreshing dashboards powered by SQL queries.
To kick things off, Parse.ly partnered with Looker, a SaaS BI platform that enables teams to run arbitrary queries and share live-refreshing dashboards with one another. Parse.ly and Looker share the philosophy of “analytics for everyone”, and we think it’s a great choice for working with Parse.ly raw data.
Pictured below is a Looker dashboard that a customer built atop our Data Pipeline, showing top-line view, visitor, and session counts, as well as pie charts breaking out devices, operating systems, and countries of origin. Existing LookML Data Apps and Blocks make this a snap. Our partnership with Looker was originally launched a few years ago and many customers have adopted Parse.ly and Looker side-by-side since then.

An example Looker dashboard built from Parse.ly’s Data Pipeline. Customer receives the streaming data (via Kinesis/S3) and loads it into Amazon Redshift, while maintaining full control over ETL process and SQL schema. Looker queries the data from Redshift, using some standard column names and types that are common to Parse.ly raw events.
However, Looker is not the only BI platform available for use. Once you have your data warehoused in a SQL engine, you have your choice of tools like Looker, Google Data Studio, Mode Analytics, Tableau, and many others, including open source options, like Jupyter Notebooks.
Raw Data accelerates Data Science
Data Science can be thought of as an intersection between programming and data analysis. One of the first problems a new data scientist encounters when working on any website is the lack of good, clean raw data about the company’s web and mobile interactions.
With Parse.ly’s Data Pipeline, this raw data is available to these teams immediately — no infrastructure build-out required. The formats and access patterns were specifically optimized to integrate with a wide range of open source data science tools, such as Spark, Python/Pandas, and R. Every single open source project that cares about data has an S3 connector and every single programming language has a fast JSON parser, so in the simplest setup, you’ll be able to get going very quickly.

The open source data science ecosystem around Spark (pictured above) has exploded in the last couple of years, but before tools like Parse.ly Data Pipeline, it was hard to get access to clean clickstream data on your users, and a robust data collection infrastructure for new events.
In Short: Our Data Pipeline puts you in control
Parse.ly’s Data Pipeline means you get to take back your data. From the point solution vendors holding it hostage. From the crappy APIs rate limiting your calls. From your bosses who told you they don’t have time for a 6-month data pipeline infrastructure build-out.
This new product leverages all the work we’ve put into building an awesome existing data collection infrastructure, which has already been scaled to collect billions of events from billions of devices. And this includes raw, unsampled data from web browsers, mobile visitors, and elsewhere. That rock-solid foundation can now be yours.
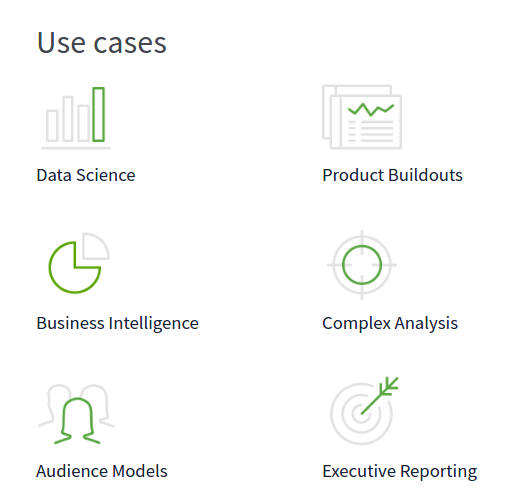
The use cases for Parse.ly’s Data Pipeline are only limited by your imagination. Some of the projects customers have taken on with Parse.ly’s new offering include exploratory data science; product build-outs; new business intelligence stacks; customer journey analyses; visitor loyalty models; and executive dashboards.
In-house analytics doesn’t need to be a chore. We’re looking forward to hearing about all the awesome things you’ll build once you’ve got your own Data Pipeline for raw streaming analytics from your sites and apps.
Get in Touch
-
If you are already a Parse.ly customer, get in touch with us, and we’ll be happy to consult you on advanced use cases for your raw data.
-
If you are not a Parse.ly customer, we are glad to schedule a demo where we can share some of the awesome things our existing customers have done with this unlimited flexibility.