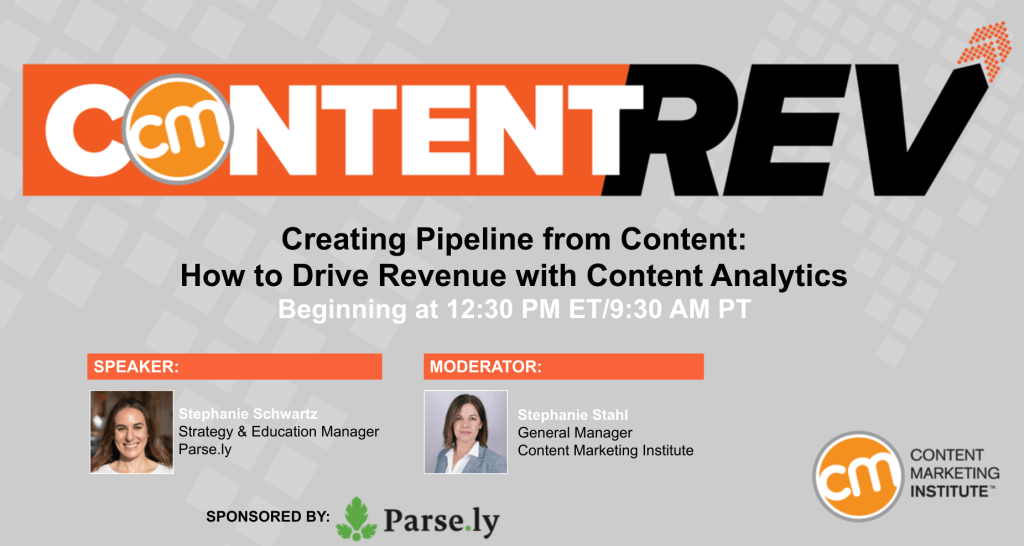
Creating Pipeline from Content: How to Drive Revenue With Content Analytics

“Data scientists everywhere are cheering at the self-service of Parse.ly.”
Stephanie Stahl (General Manager, Content Marketing Institute)
Content analytics can be hard, but they don’t have to be.
In a recent webinar with Content Marketing Institute, Parse.ly’s Strategy and Education Manager, Stephanie Schwartz, shared advice on driving revenue with content by using analytics—the easy way.
“At the heart of it lies three core things: people, process, and technology,” Stephanie says. “You have to have all three for this to work. You need the right people, who have the right process in place, so they can execute on the insights that the right technology provides.”
There are four aspects of creating pipeline from content marketing:
- Build content that drives decisions
- Identify and exploit high-performing content
- Improve the performance of existing content
- Get everyone involved in analytics
We explore each below.
1. Build content that drives decisions
Stories connect us. To readers, brands tell stories that drive purchasing decisions; to internal stakeholders, brands tell stories that drive investment and resource decisions.
In the digital age, stories must be told at every single touch point to offer a cohesive brand experience, whether your audience is seeing your content in an email, on your website, in a report, or anywhere else.
Whatever content you create must be high-quality and aligned with your brand story in a way that moves readers through the sales funnel. If your audience senses a disconnect, they will be less inclined to move through the buyer journey and more likely to bounce from your content.
2. Identify and exploit high-performing content
One of the biggest ways to drive pipeline from content is identifying content that is already performing well, and boosting it. For example, if a Top Listings Report in Parse.ly says a recent blog is influencing many conversions, feature it at the top of your blog or other places on your website, in a newsletter, or as part of an ad campaign.
“When looking at metrics, check more than just pageviews, because pageviews don’t tell you the entire story,” Stephanie explains.
Engaged time and recirculation rate can tell you which content is resonating well, what people are spending the most time on, and the topics keeping readers on the site the longest.
In the Parse.ly dashboard, any stakeholder can quickly track and see who is clicking on a campaign, and who is converting. If you see a campaign strong in conversions, find ways to improve omnichannel engagement (easily measurable in Parse.ly).
Q: What are the benefits to real-time measurement?
A: If people are converting the day your content is published, you can see that with real-time analytics, rather than waiting days. If you’re getting traction, you can boost performance further. If the content is underperforming, you can make adjustments immediately to get the most out of your efforts.
3. Improve the performance of existing content
Many teams focus on top-performing content and ignore the pieces at the bottom But every piece of content matters and might be able to contribute to your bottom line with just a little improvement.
For example, if an article shows high engagement but low pageviews, update the location of that post on your site, increase the number of internal links to it, and find other ways to boost it externally.
Alternatively, if traffic is high but engagement is low, add links to relevant, related content throughout the piece and experiment with placing your CTA higher in the body.
Q: What’s included in the dashboard besides pageviews and engagement? What about the cost to create or optimize a piece of content?
A: It’s difficult to accumulate all the information to accurately measure the cost of creating a piece of content. However, you can certainly identify and set your own benchmarks for success, and use Parse.ly to measure those results. The great thing about the dashboard is how customizable it is. Each user, no matter their role, can add any metrics and data sets that are important to them in their dashboard for a quick and easy overview.
4. Get everyone involved in analytics
When your entire team actively uses your content analytics tool, it’s easier to spot ways to improve performance and ensure everyone is moving in the same direction toward goals.
“The point of using a dashboard like Parse.ly’s is so you don’t have to rely on the ‘data person’ to pull that data for you,” says Stephanie. “You can get the information in real time, as it’s happening today. It’s built for writers, editors, marketers, and content creators. It’s not just for analysts.”
Audience question
Q: Are there any metrics you recommend tracking on a regular basis?
A: We have to understand your goals first: what does success mean for you? Is it lead gen? Brand awareness? Your ideal metrics will look different based on your goals. It’s not just about raw clicks, it’s about using multiple metrics to create a full picture of what works for your goals. The great part of Parse.ly is how easy it is to customize based on your role and what metrics matter to you. We have lots of great resources to help you identify which metrics to track.
Usership is essential to maintaining a strong analytics strategy. By keeping data top-of-mind, you ensure your team is dedicated to delivering content that connects with your audience throughout the sales pipeline.